

TOC (ASCE/SEI 55-16)
Provisions
CommentaryA PROCEDURE FOR DETERMINING MODULUS OF ELASTICITY
Architectural membranes that contain a woven or laid fabric substrate are composite materials. Composites are defined as materials made up of fibers of one type of material embedded in a matrix of another type of material. One such layer is known as a lamina, two or more laminae are known as a laminate. Composites where the orientation influences the structural behavior are anisotropic. If the fibers in a lamina or laminate are oriented at 90° to each other, the material is orthotropic.
Most architectural membranes have a woven or knit substrate and are orthotropic. They are usually one lamina thick. Their compression capacity generally is negligible.
The analysis of orthotropic and anisotropic composites is well developed and has been incorporated into many finite element programs. Most of the programs used to analyze architectural membranes consider nonlinear displacements but treat the materials as linear and elastic.
A significant source of nonlinearity in woven membranes is a direct consequence of the weaving process. Woven warp and fill yarns cross over and under each other. The warp yarns are often initially straighter than the subsequently woven fill yarns. When the composite material is loaded in one direction, the yarns parallel to that direction tend to straighten. The yarns perpendicular to the direction of load tend to accept more crimp. The elongation characteristics of architectural membranes tend to be dependent on the direction of load, magnitude of the load, and relative amount of load distributed among the orthogonal yarns. The geometric interaction of the yarns caused by varying orthogonal load ratios is analytically modeled as a Poisson effect. The geometric interaction of warp and fill yarns may result in Poisson values significantly larger or smaller than those associated with most materials.
Laid membranes and woven membranes have nonlinearity associated with the elongation characteristics of the material used in the yarn, regularity of the yarn, and interaction of the yarn with the matrix material.
The general relationship between stress and strain is
It is a property of linear elastic materials that
Because fabrics are only capable of carrying tensile loads, Eq. (B-5) is written
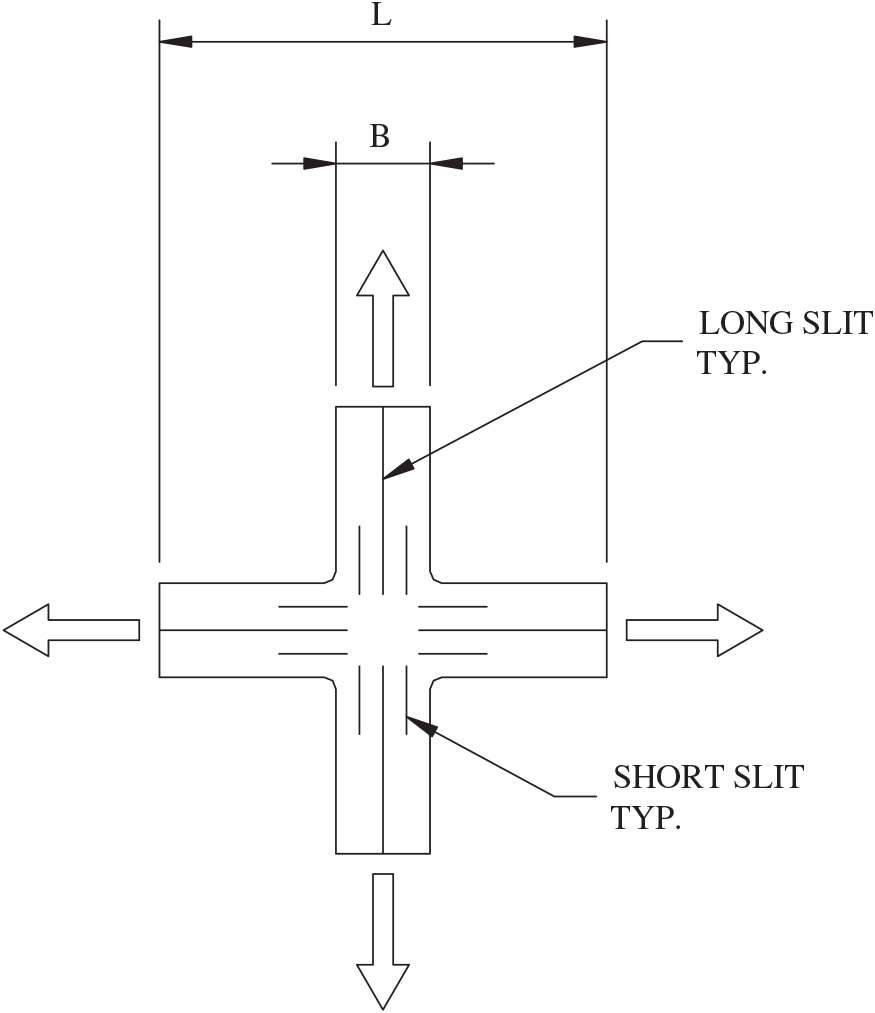
The most common method of testing fabrics today is to test a cruciform specimen (Fig. B-1). In this test, stress and strain are concurrently measured in the two orthogonal directions of warp and fill. One way of doing this is to keep a fixed ratio of warp–fill force and vary both while keeping the ratio constant. This is the manner in which Figs. B-2 and B-3 were obtained (Minami and Motobayashi 1984). The curves in both figures designated as warp plot the stress–strain curve of the warp when the ratio of warp to fill forces is held constant at. The curves in both figures designated as fill plot the stress–strain curve of the fill subject to the same ratio.
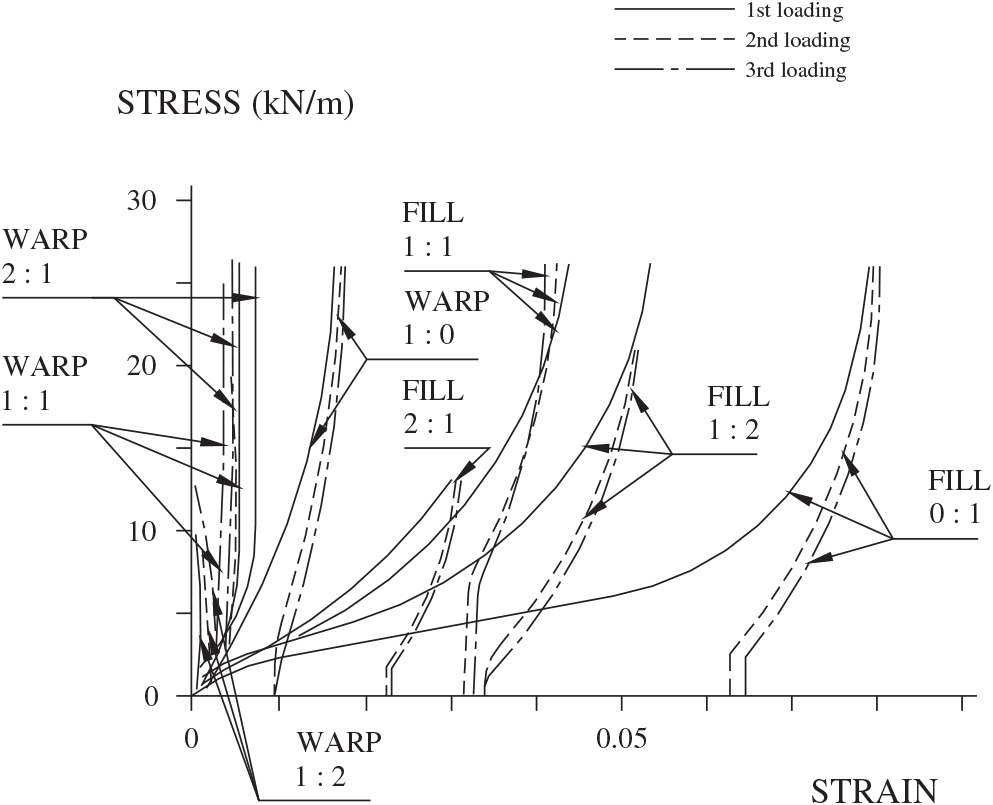
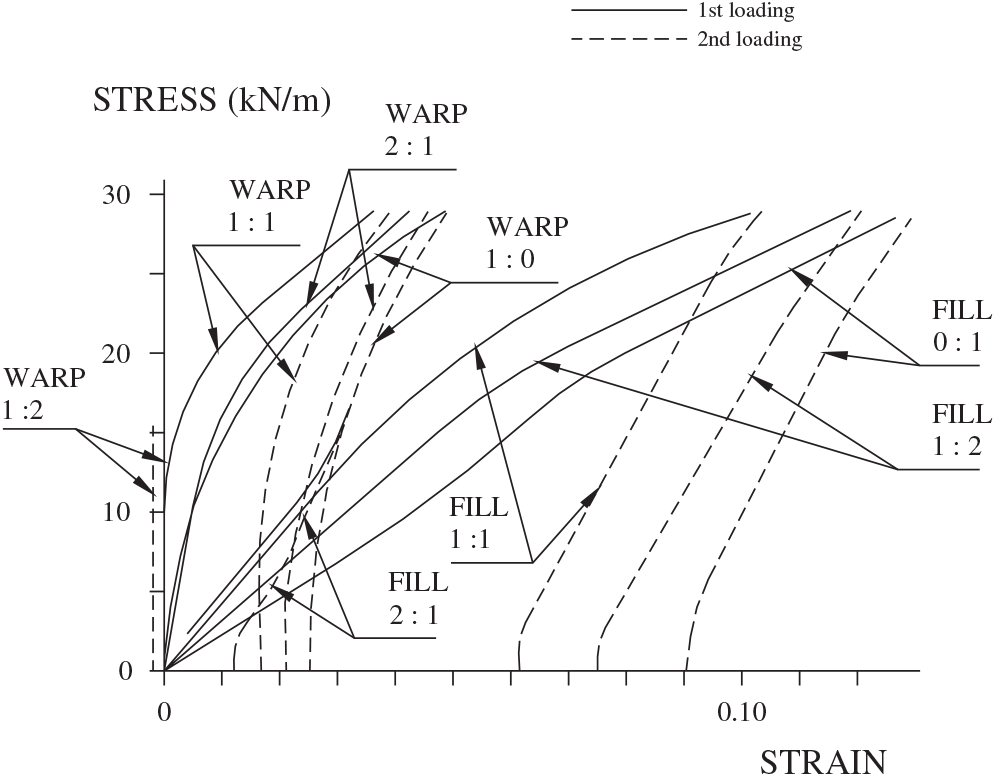
Numerous testing techniques are not discussed here but are discussed fully elsewhere (Membrane Structures Association of Japan 1995). Figs. B-2 and B-3 show typical results of stress–strain tests on fiberglass and polyester, respectively. Table B-1 gives the properties of the fiberglass and the polyester that were tested.
| Yarn | Coating Material | Breaking Strength (kN/m) |
|---|---|---|
| Glass Fiber | Polytetrafluroethylene (PTFE) (Teflon) | 144/128 (warp/fill) |
| Polyester | Polyvinyl choride (PVC) | 128/90 (warp/fill) |
Several observations can be made from examination of Figs. B-2 and B-3. Both the fiberglass and the polyester test results show the nonlinear nature of both materials, particularly on the first application of loading. The behavior more closely approaches linear on the second and subsequent loadings. The fiberglass shows strain hardening as the force increases. The increasing slope of the stress–strain curve shows this change as the force increases. In contrast, the polyester shows strain softening by the decreasing slope of the stress–strain curves.
It is generally not necessary to examine these curves when stresses are a high percentage of the breaking stress, as shown in Table B-1, because these high stresses are not permitted to occur in the fabric design. Accordingly the one-quarter breaking strength limitations of Table B-1 are shown on Figs. B-2 and B-3. Nothing above these lines need be examined. For simplicity, the lower values of one quarter of the breaking strength of the fill are chosen as the cutoff values. The curves for the first few kilonewtons of force also can be ignored because at these low forces the coating carries a high percentage of the load. Also, at low forces the slack in the weaving of the yarns skews the results.
The curves in Figs. B-2 and B-3 show the results of the stress versus strain tests. The stress–strain relationship is not linear; the slope of the curve varies from point to point. Hence, if the MOE were to be found directly from these curves, the MOE would vary with the stress. It is difficult and usually not necessary to work with a MOE that varies with stress. Most practical design is done using a single value for the MOE. To find this single value for each of the two MOEs, it is necessary to choose a slope for the stress–strain curves, in other words, choose representative straight lines. There are many ways to linearize test data. The usual procedure is to use the least squares method (LSM). The LSM is straightforward and is described in math texts, frequently under the heading of linear algebra. It is not necessary to be familiar with the method to use it. Many computerized mathematics programs include it under the single command of “least squares.” If the test data are entered, the least squares command performs all the mathematical steps and produces a straight-line linearization.
Fig. B-4 is adopted from Fig. B-2 and shows the LSM linearization of the test curves of Fig. B-2. There are seven straight lines shown for the linearization of warp and fill test results for the three different warp–fill ratios of loading. These seven lines may be used in place of the curved test results. Fig. B-4 has been simplified by showing only the curves of first loading from Fig. B-2. Also, the uniaxial curves of fill and warp are removed, because they are not biaxial behavior curves and they give erroneous values. The negative slope to the warp line can be explained by the way in which the fabric is made. When the fabric is made, the warp fibers are pulled straight and the fill fibers are woven around the straight warp threads. If there is a high fill stress accompanied with a low warp stress, the warp fibers are bent and, hence, shorten. It should be noted that, contrary to uniaxial tests, both directions of the fabric stretch for most loadings.
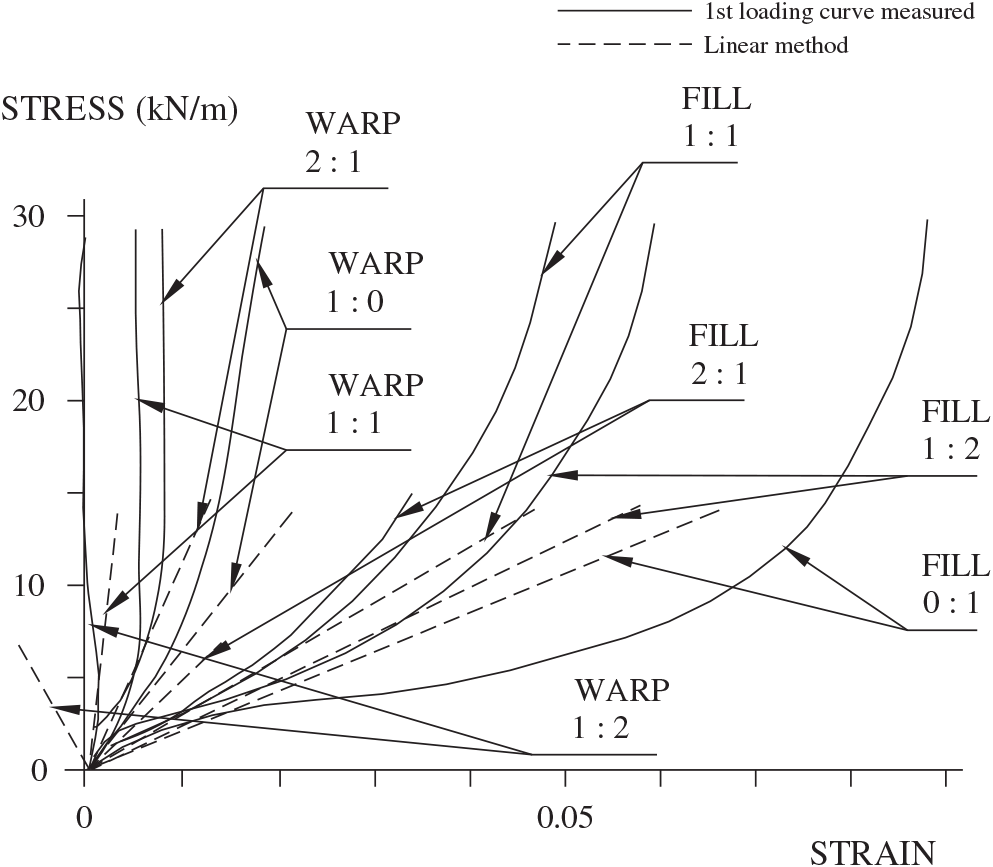
The equations in Eq. (B-7) combined with the six straight lines are used to find the four unknowns of, , , and. The slopes of the six straight lines are not themselves MOEs; however, they are used to find the MOEs. This technique is used to take stress values along with their associated strain values from the straight lines and insert them into Eq. (B-7). The values used must be consistent with the actual test procedures; in other words, if the warp–fill lines associated with a ratio are used, then the fill stresses used in Eq. (B-7) must equal half the warp stresses, and so forth. In principle, any of the six straight lines could be used to find the four unknowns. However, in practice all the lines should be used and the results averaged. Table B-2 shows the values for the MOE and Poisson’s ratio that were obtained from the foregoing procedure.
| Ew | Ef | wf | fw |
|---|---|---|---|
| 634 kN/m | 213 kN/m | 0.29 | 0.87 |
The MOE and Poisson’s ratios shown in Table B-2 are only for the specific fiberglass material tested and only for the first loading. As would be expected from the much steeper stress–strain curves in Fig. B-2 for the second and third loadings, the MOE for these loadings would be considerably higher. Some materials have been preloaded to partially eliminate the high permanent stretch of the first loading. The final selection of MOEs, of necessity, requires modification by engineering judgment. Only the engineering designer can estimate the level of stress attained by the structure over its lifetime. This level, in turn, affects the actual MOE to be selected for design of the structure.
Membrane Structures Association of Japan. (1995). Testing method for elastic constants of membrane materials, Standard, Membrane Structures Association of Japan, Tokyo.
Minami, H., and Motobayashi, S. (1984). “Biaxial deformation property of coated plain-weave fabrics,” Proceedings of International Symposium on Architectural Fabric Structures, Vol. 1, Orlando, FL.
Commentary