

TOC (ASCE/SEI 7-22)
Provisions
CommentaryWind Hazard Maps for Long Return Periods
Except as provided in Sections 26.5.2 and 26.5.3, it shall be permitted to determine the wind speed used for design wind loads on buildings and other structures from Figures F.2-1 through F.2-3 as follows:
Alternatively, it shall be permitted to use the wind speed from the ASCE Wind Design Geodatabase for the contiguous United States.
User Note: The ASCE Wind Design Geodatabase is available at the ASCE 7 Hazard Tool (https://asce7hazardtool.online/), or approved equivalent.
Commentary
Wind Hazard Maps for Long Return Periods
CF.1 Scope
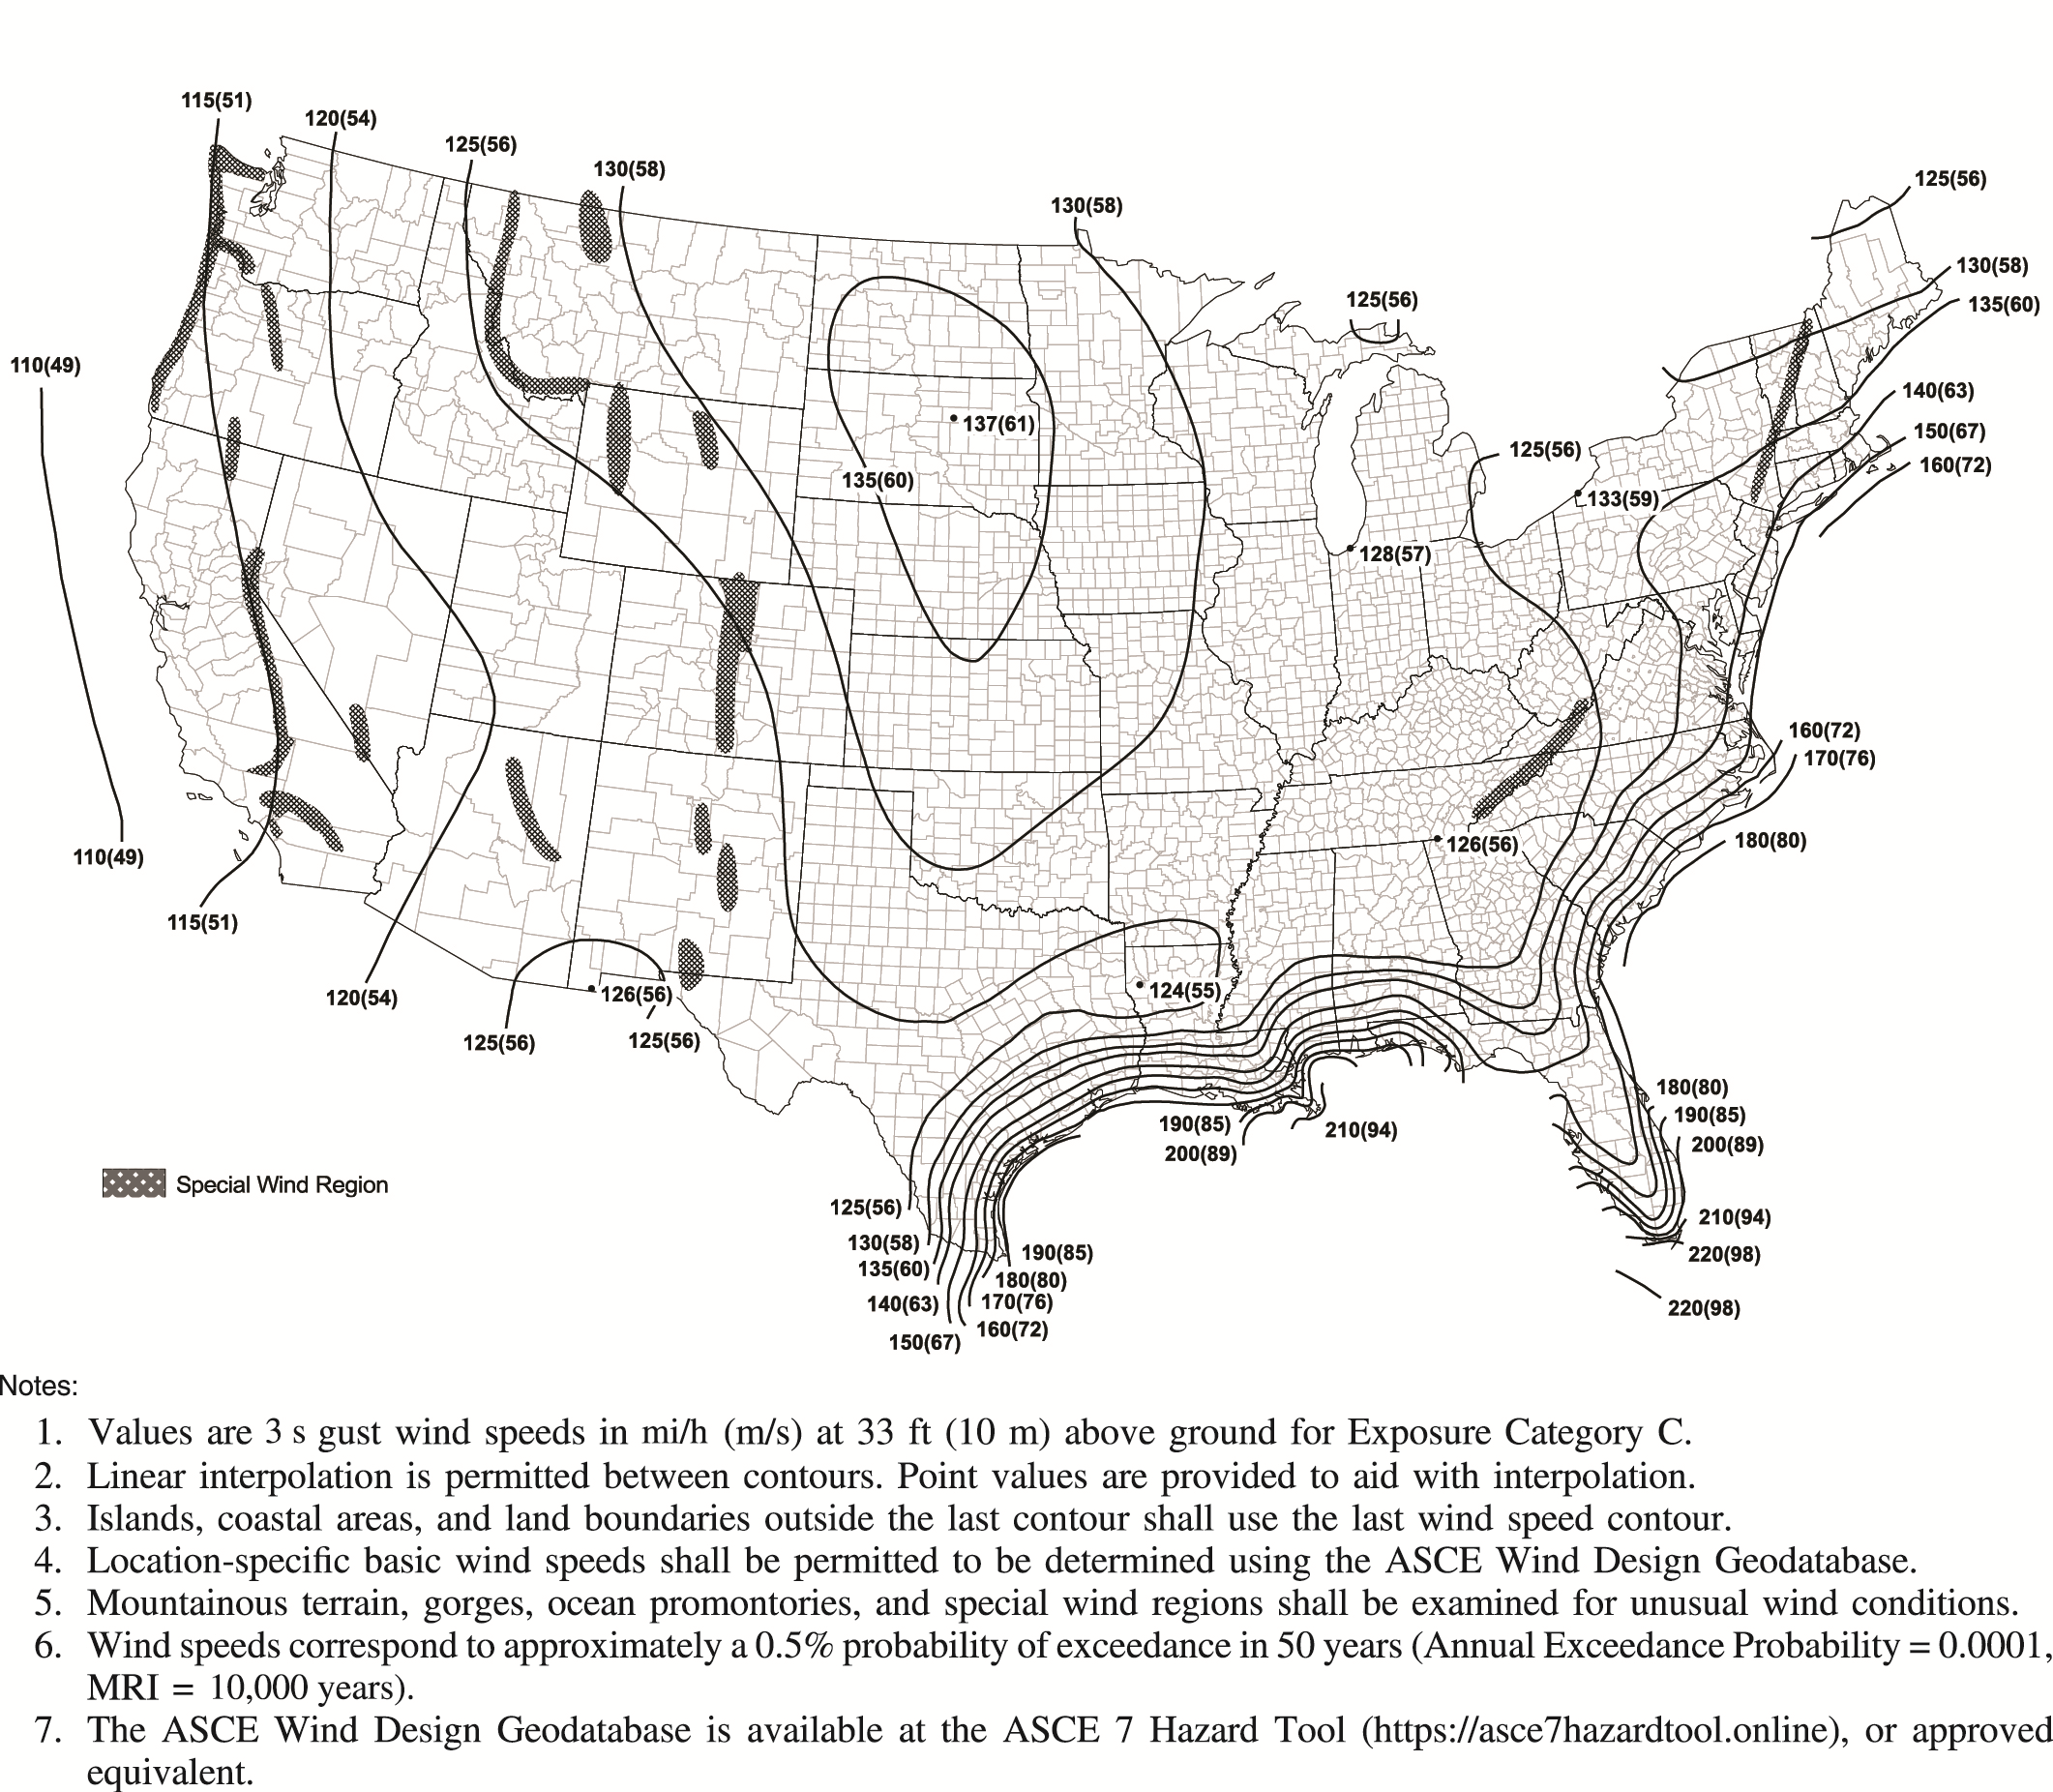
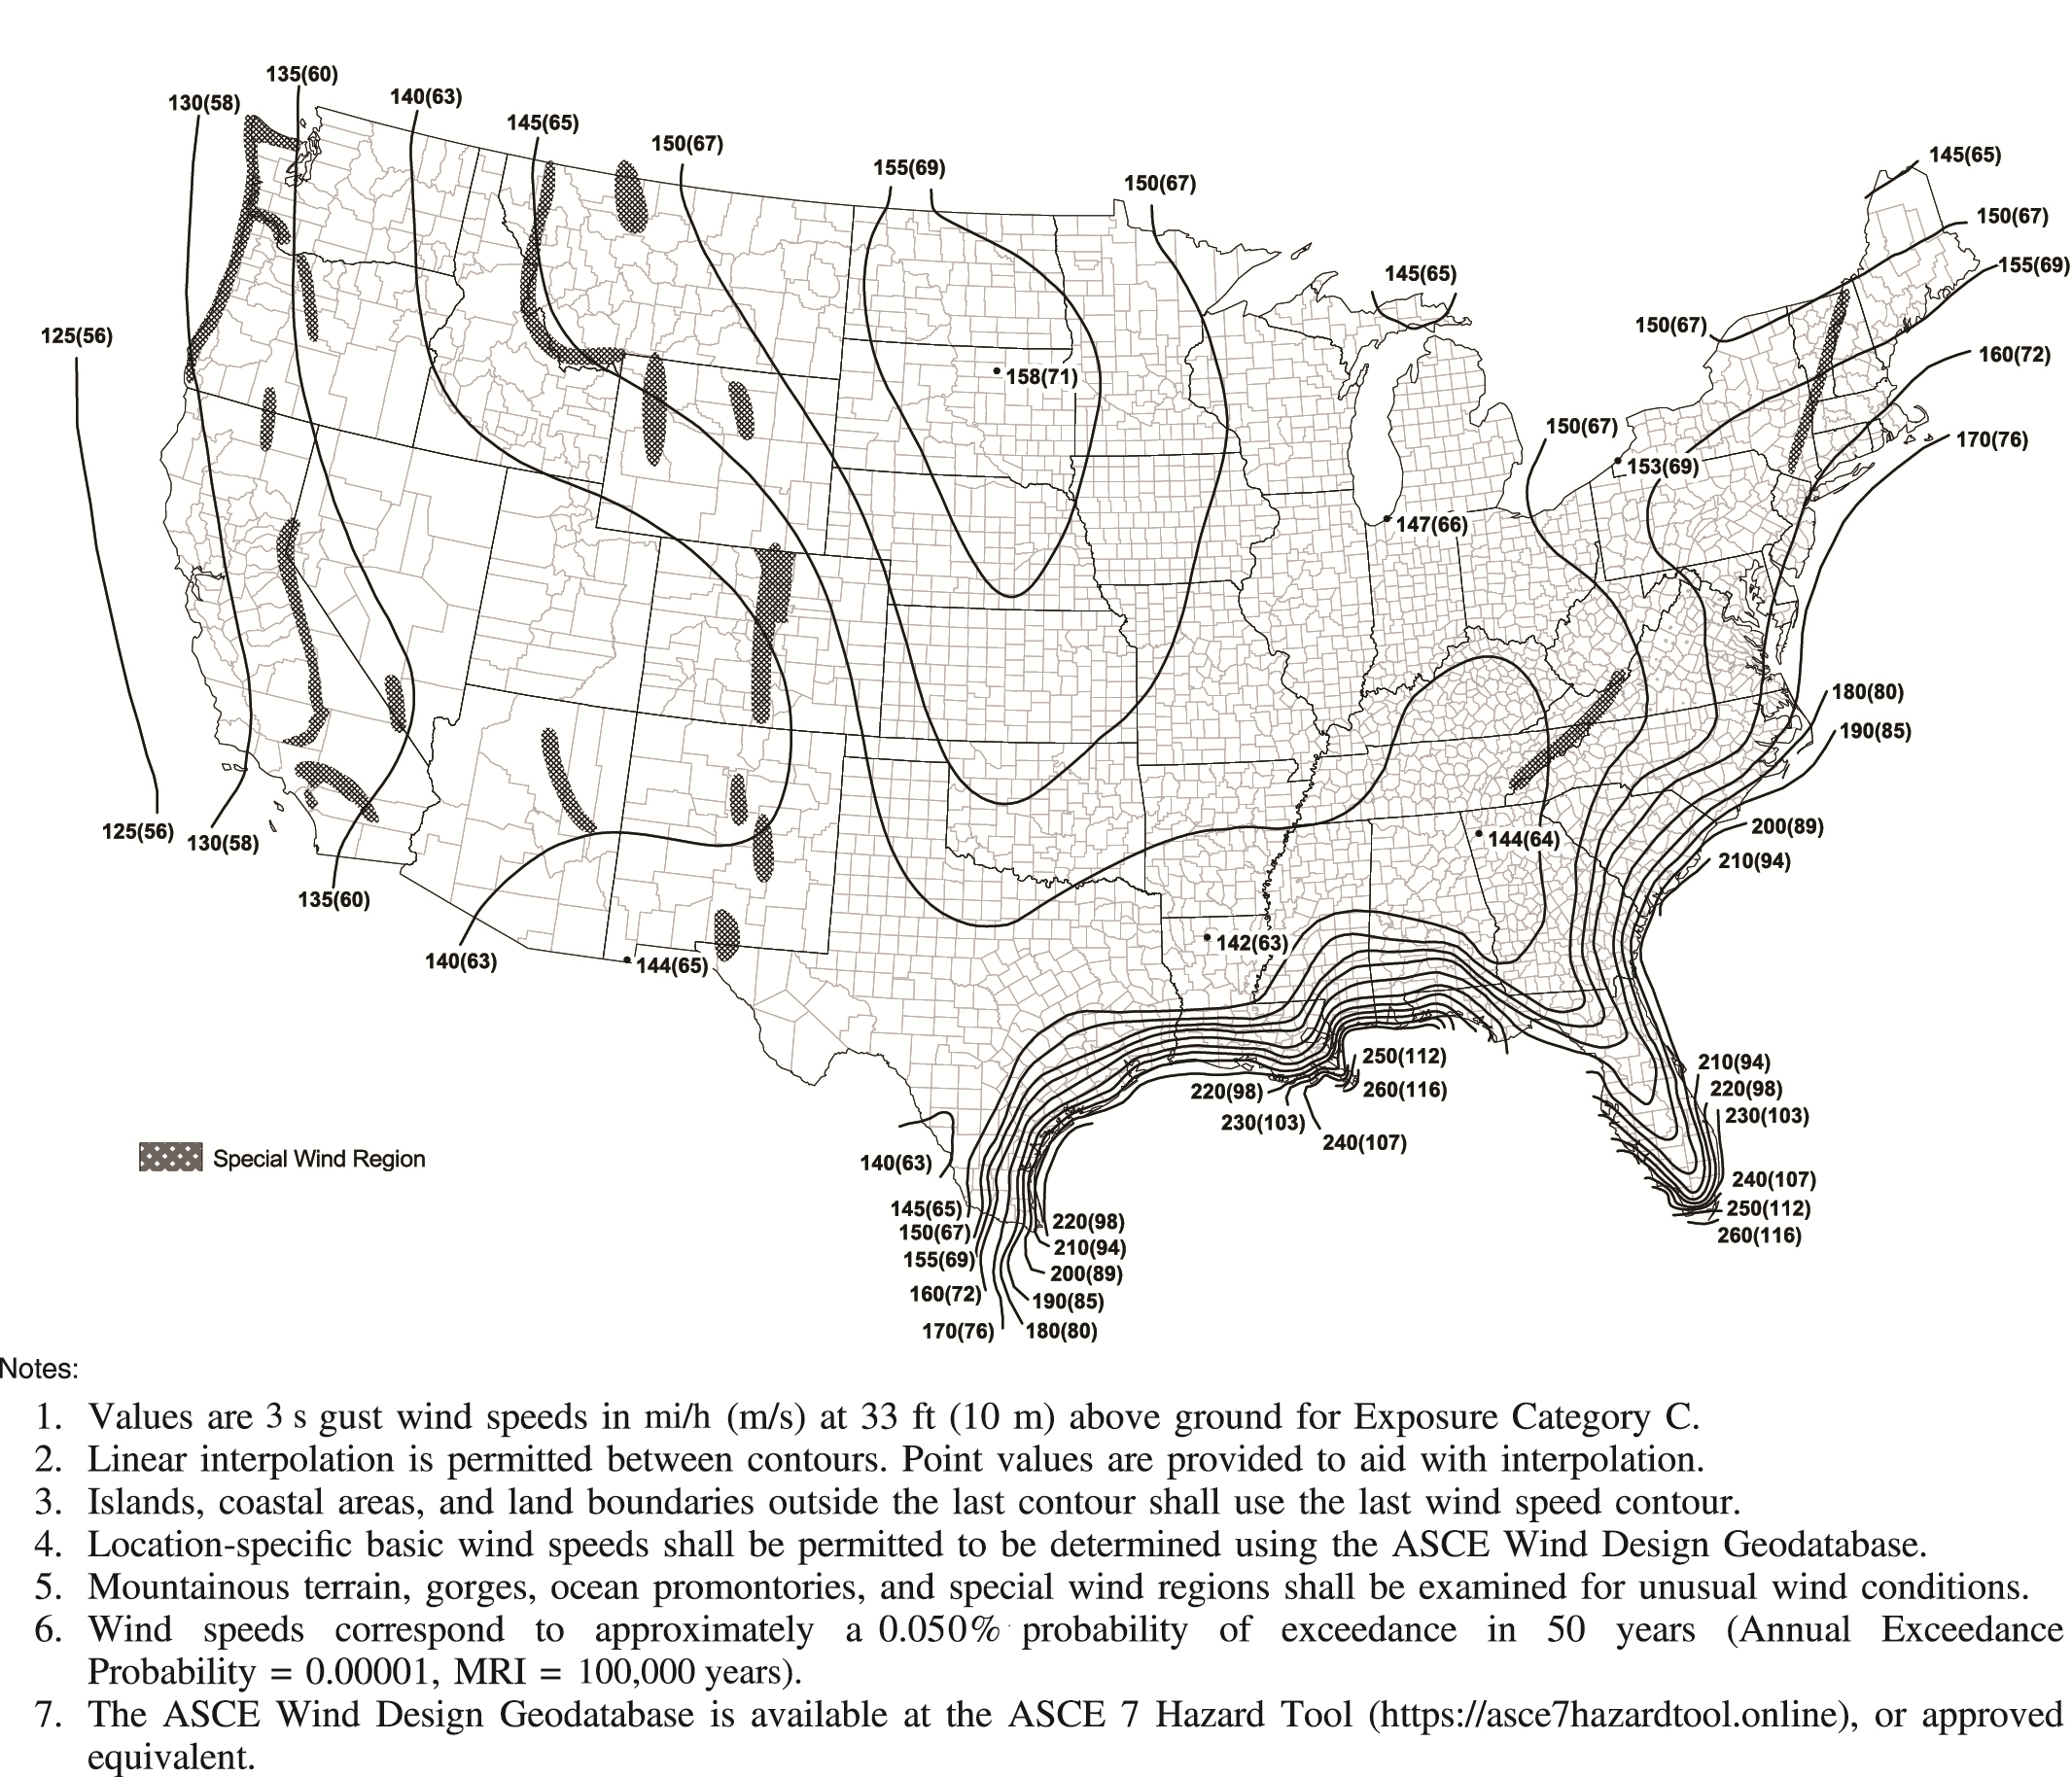
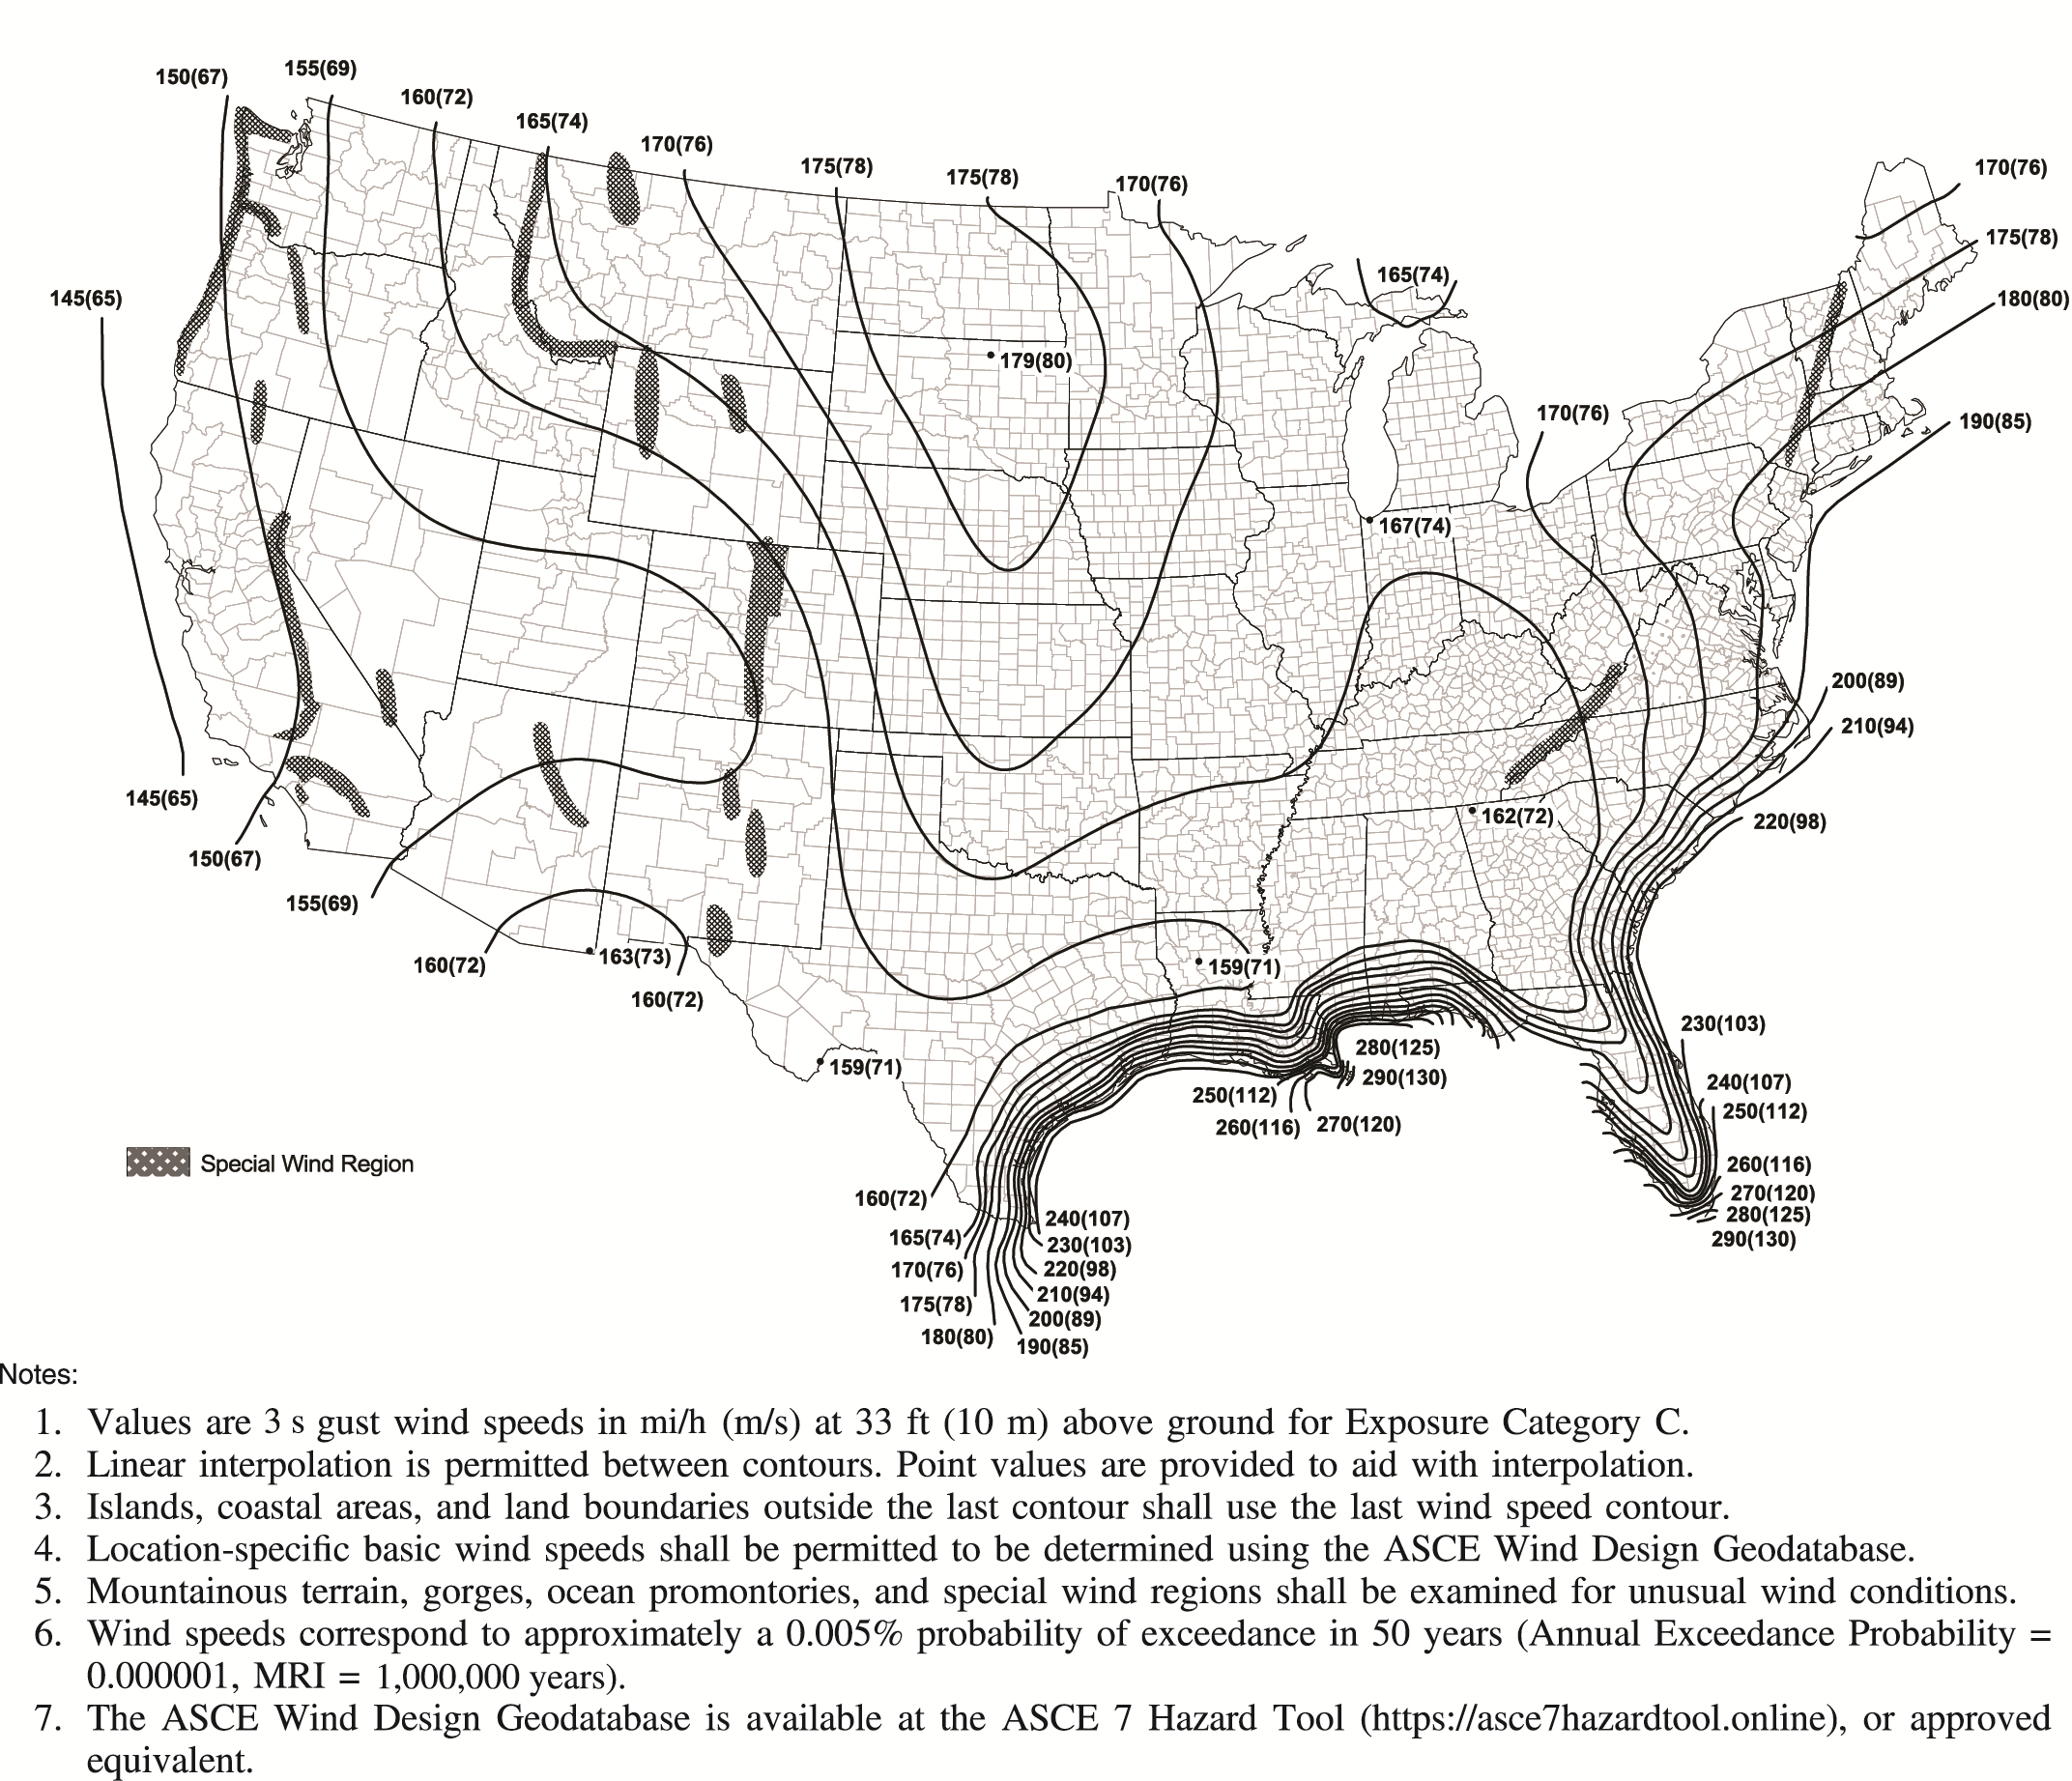
This appendix provides wind hazard maps for longer mean recurrence intervals (MRIs) than those included in Chapter 26 in support of performance-based wind design applications where use of hazard levels above the minimum specified in the standard may be appropriate or design scenarios are required in which extreme performance is explicitly assessed (e.g., incipient collapse of the main wind force resisting system). The explicit consideration of such design scenarios requires estimates of the wind hazard with MRIs well beyond those associated with the standard risk categories, for which current practice essentially requires elastic component performance. These maps will provide input for developing acceptance criteria associated with such design scenarios. In addition, design for longer MRIs may be needed for wind load designs required by other codes and standards. The maps presented in this appendix are not tied to a specific risk category like the maps in Figures 26.5-1 A–D, which represent preselected MRIs of 300, 700, 1,700, and 3,000 years for Risk Categories I through IV, respectively. For the longer-MRI maps in this appendix, it is expected that the owner, perhaps in consultation with the designer, will select the appropriate map for their particular application. In some unique situations, the Authority Having Jurisdiction may require a higher MRI. For example, certain liquefied natural gas facilities require design for winds “having a probability of exceedance in a 50-year period of 0.5 percent or less” (i.e., 10,000-year MRI winds; PHMSA 2019).
Where the longer return period wind hazard maps of this appendix are being used, the designer should also refer to Appendix G to determine a tornado speed at the same return period for use with the tornado load provisions of Chapter 32, where applicable.
CF.2 Wind Speeds
The mapped wind speeds for the contiguous United States shown in Figures F.2-1 through F.2-3 were developed using the same methodology as the basic wind speed maps in Figures 26.5-1A–D, described in commentary Sections C26.5.1 and C26.5.2. The special wind regions shown on Appendix F wind hazard maps are unchanged from those on Chapter 26 maps.
Uncertainties in the estimated wind speeds increase with increasing wind speeds and increasing return periods. For the non hurricane component of the extreme wind climate, standard errors of the estimated speeds range from approximately 10 to 13 mi/h (4.5 to 5.8 m/s) for 10,000-year MRI and from 13 to 16 mi/h (5.8 to 7.2 m/s) for 100,000-year MRI. This compares to standard errors of approximately 7 to 9 and 9 to 11 mi/h (3.1 to 4.0 and 4.0 to 4.9 m/s) for 700 and 3,000-year MRI, respectively [see Appendix C.1 in Pintar et al. 2015) for maps of standard errors at these and other MRI]. In the case of hurricane winds, no formal uncertainty studies were undertaken; however, as discussed in Vickery et al. (2009), the uncertainties associated with the 50-year and 100-year MRI wind speed vary with location along the coastline, exceeding 10% for locations north of New York. It is expected that for return periods longer than about 1,000 years, wind speed uncertainties along the hurricane coastline would be comparable to those in the non-hurricane-prone regions. The hurricane winds include the effect of wind field modeling uncertainties. The wind speed uncertainty term is the same as that used in the development of the ASCE 7-10 and ASCE 7-16 wind speed maps. This error term increases the 100-year return period wind speed by a few percent, and the longer MRIs by approximately 10% (Vickery et al. 2011).
A procedure for estimating wind speeds in Alaska as a function of return period is described by Peterka and Shahid (1998).
The 10,000-year MRI wind speeds associated with hurricanes in Hawaii and US territories (known as typhoons in Guam and the Northern Mariana Islands and cyclones in American Samoa) are provided in Table CF.2-1. Only single wind speed values are available for Hawaii, Puerto Rico, and US Virgin Islands at this return period. All wind speed values in Table CF.2-1 are for 3 s gusts at 33 ft (10 m) above ground for Exposure Category C. These values were determined using the hurricane modeling procedures described in Section C26.5.1. Winds associated with events other than tropical cyclones have not been explicitly considered but are assumed to have negligible contribution to the extreme wind climate at the 10,000-year MRI level.
* Wind speeds are 3 s gust speeds at 33 ft (10 m) above ground for Exposure Category C.
Appendix CF – References