

TOC (ASCE/SEI 7-22)
Provisions
CommentaryTornado Hazard Maps for Long Return Periods
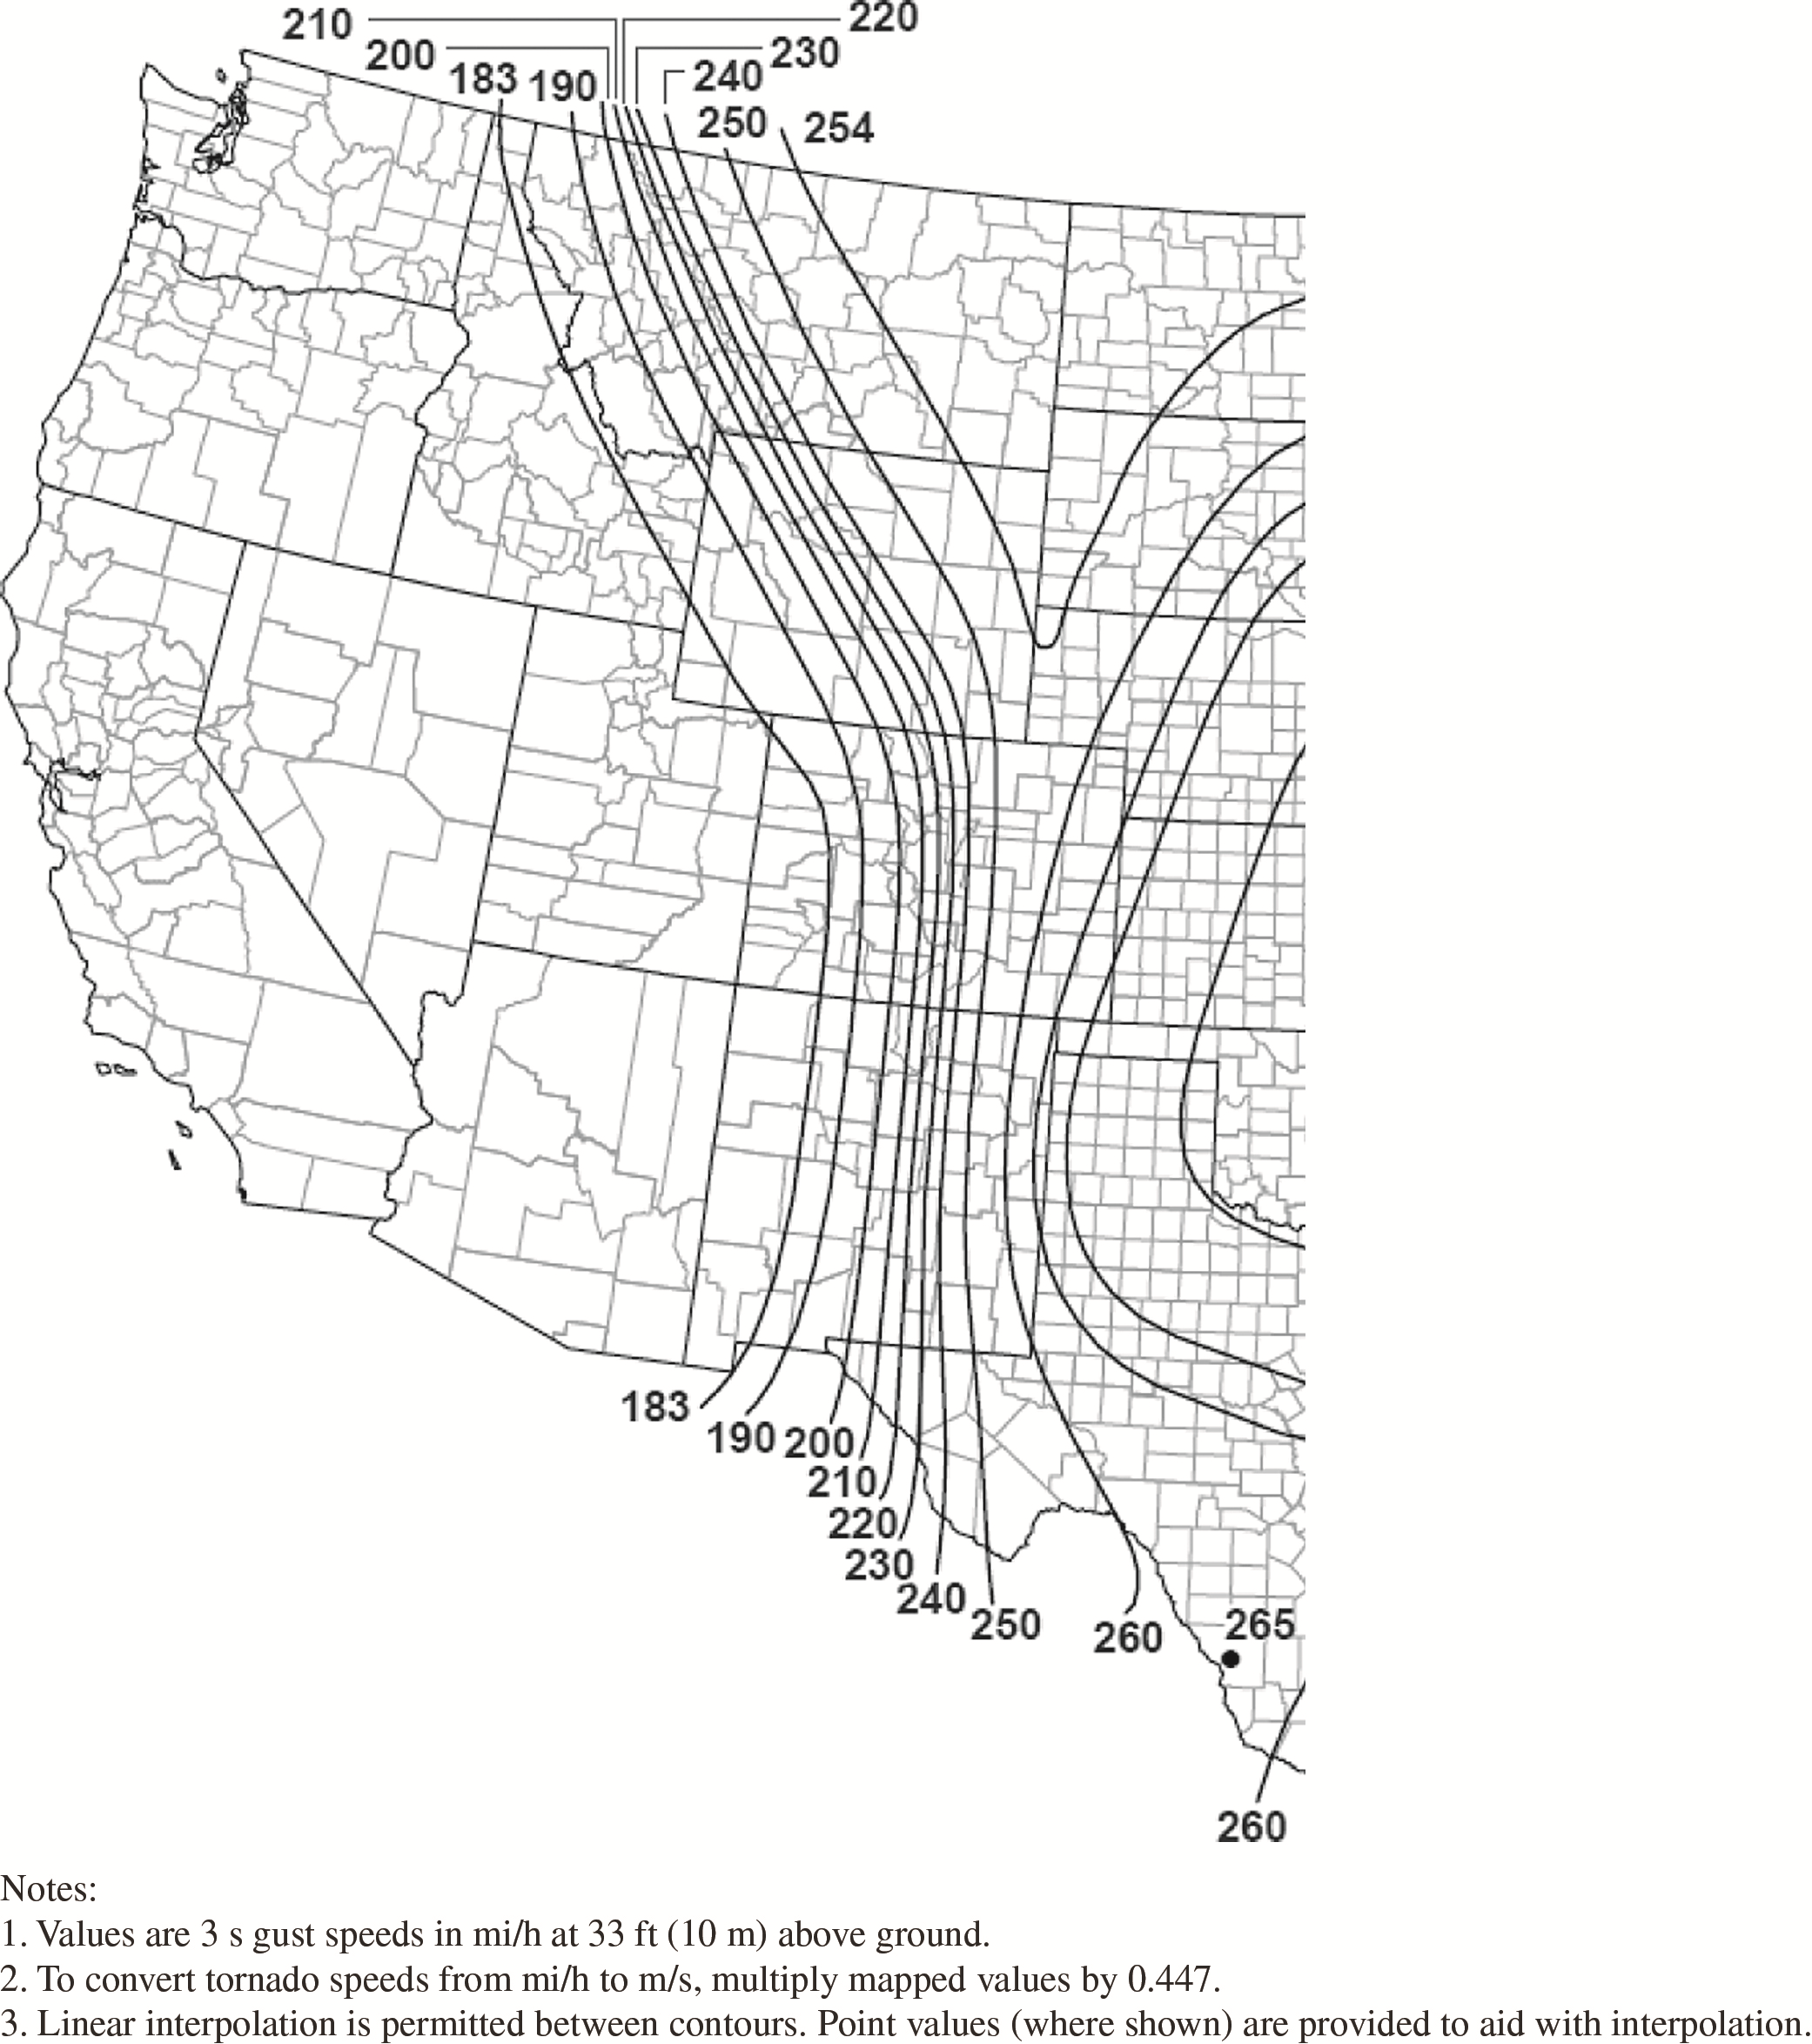
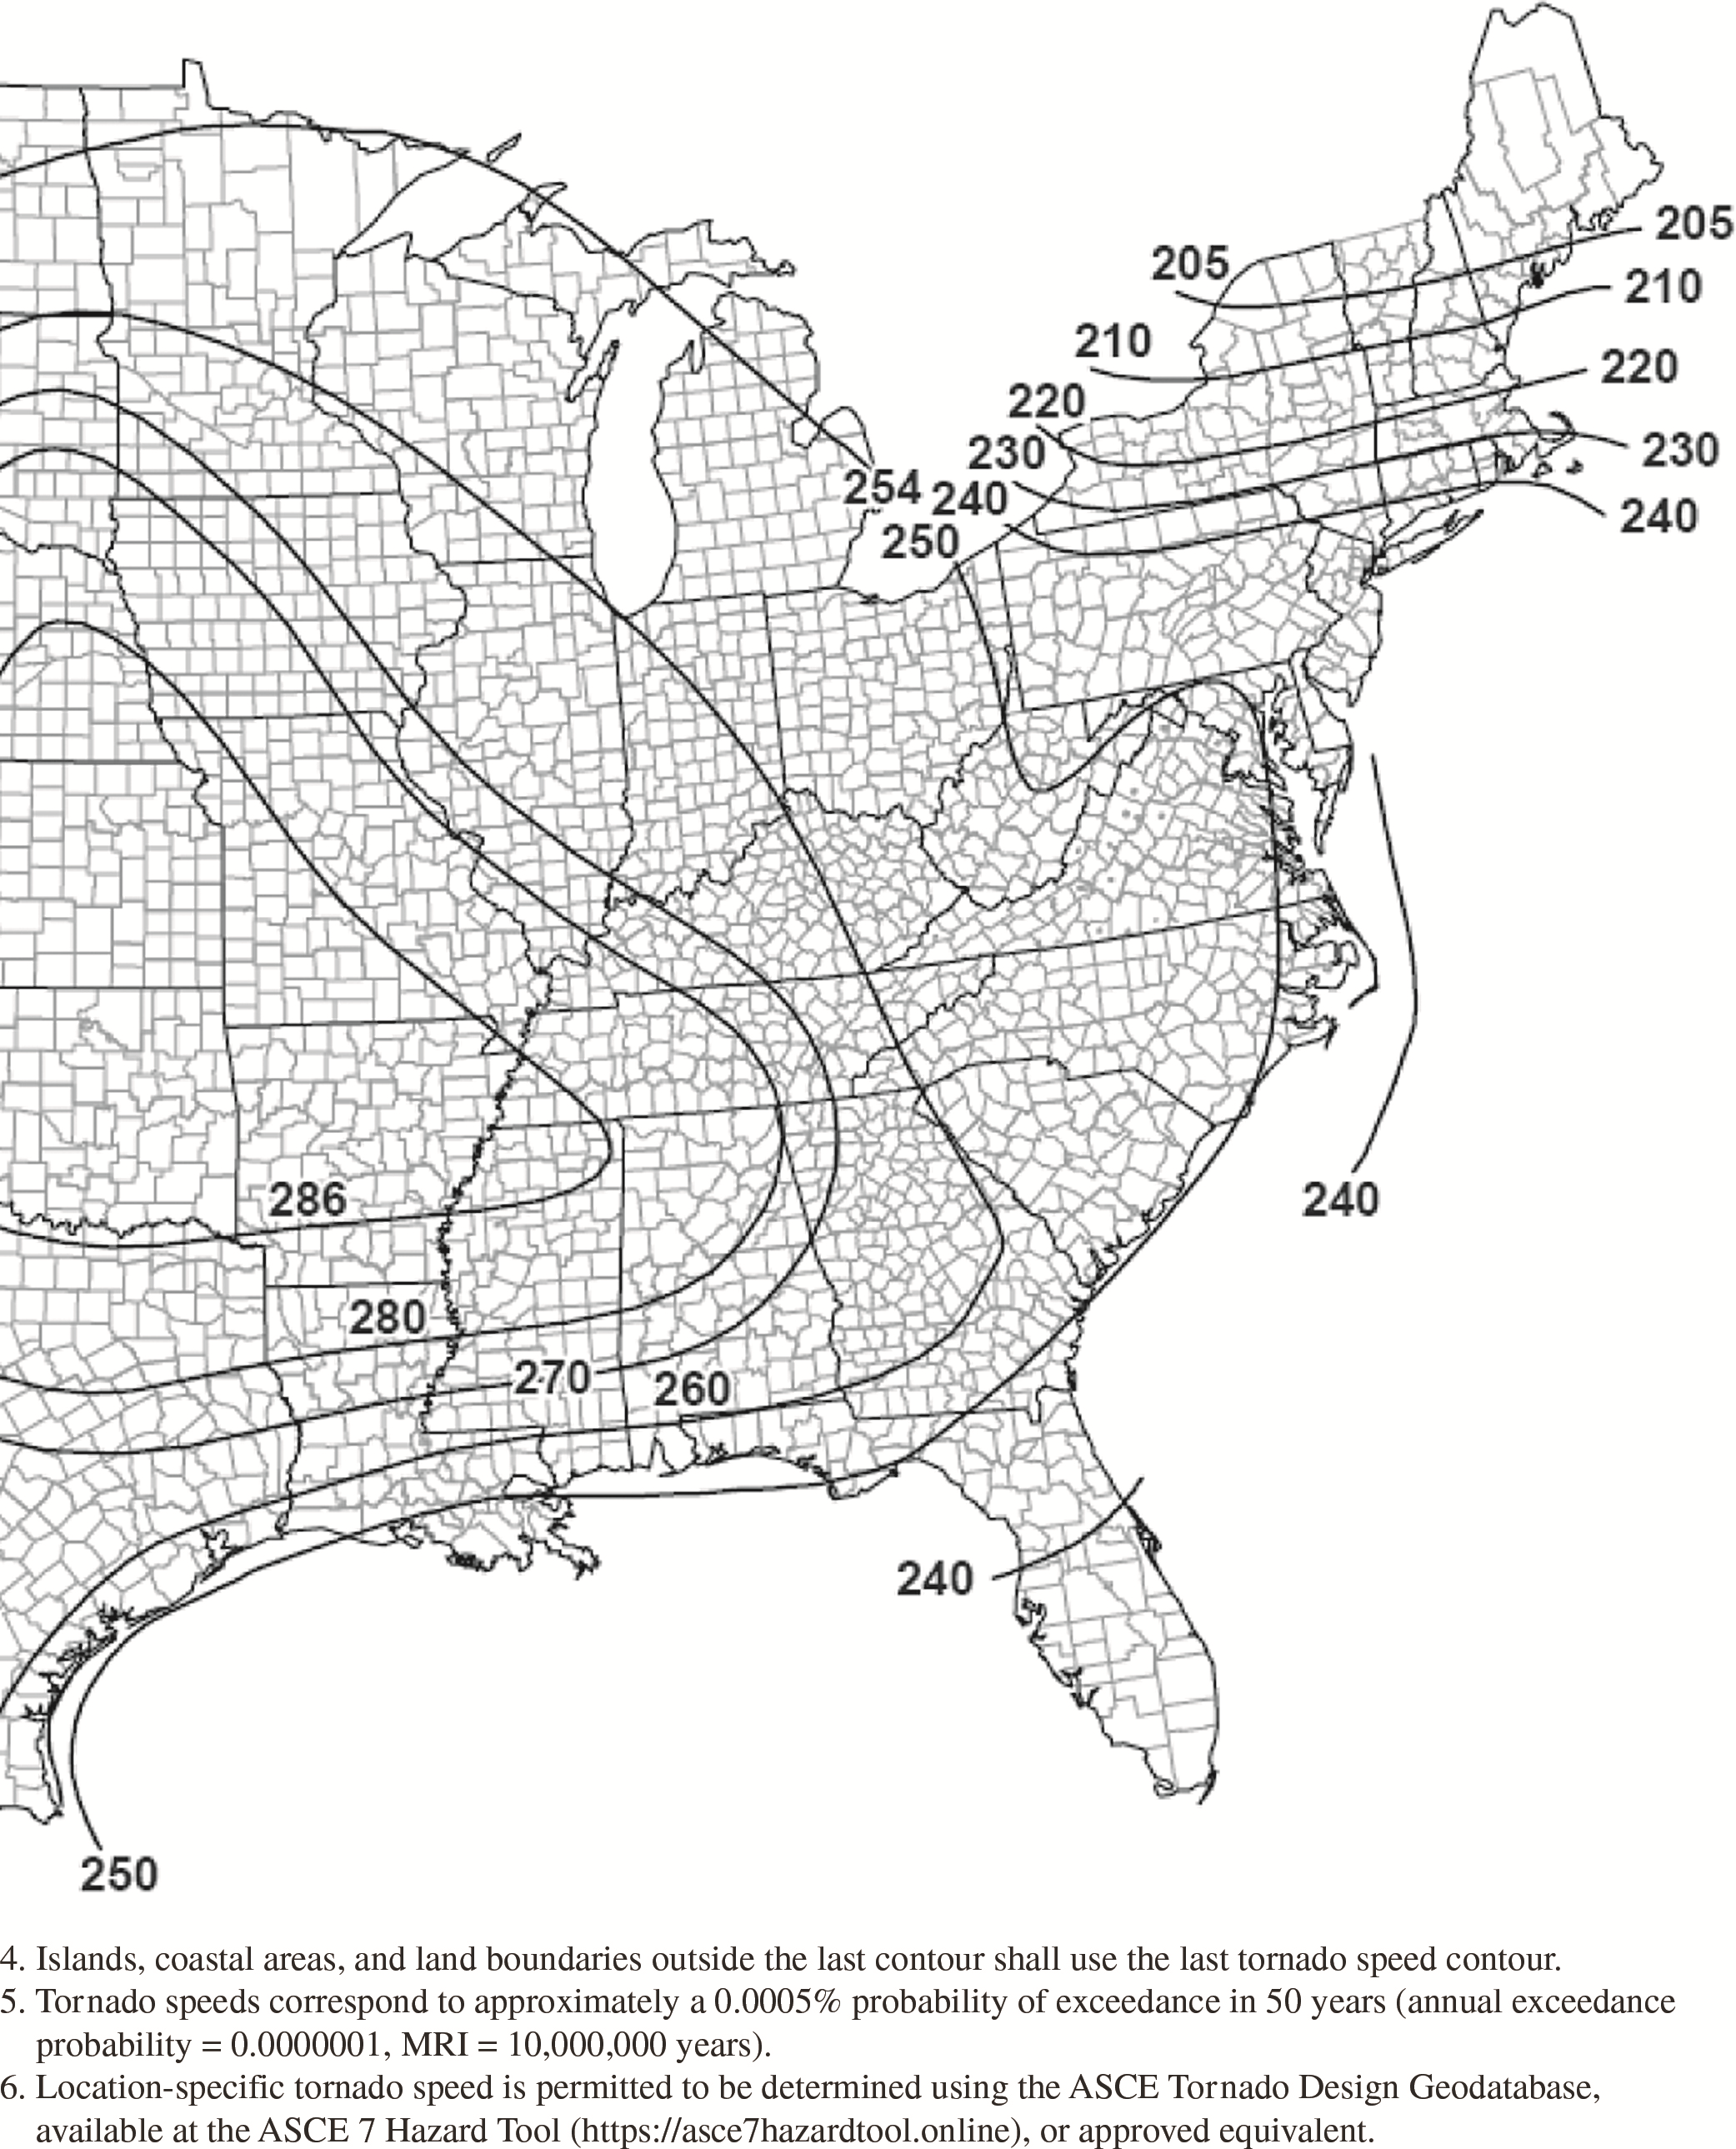
It shall be permitted to determine the tornado speed used for design tornado loads on buildings and other structures from Figures 32.A2-1 through G.2-4 as follows:
Alternatively, it shall be permitted to use the tornado speed
from the ASCE Tornado Design Geodatabase. The ASCE Tornado Design
Geodatabase is available at the ASCE 7 Hazard Tool (https://asce7hazardtool.online/), or approved
equivalent.
Figure G.2-1A. Tornado speeds for 10,000-year MRI for effective
plan area of 1 ft2
(0.1 m2).
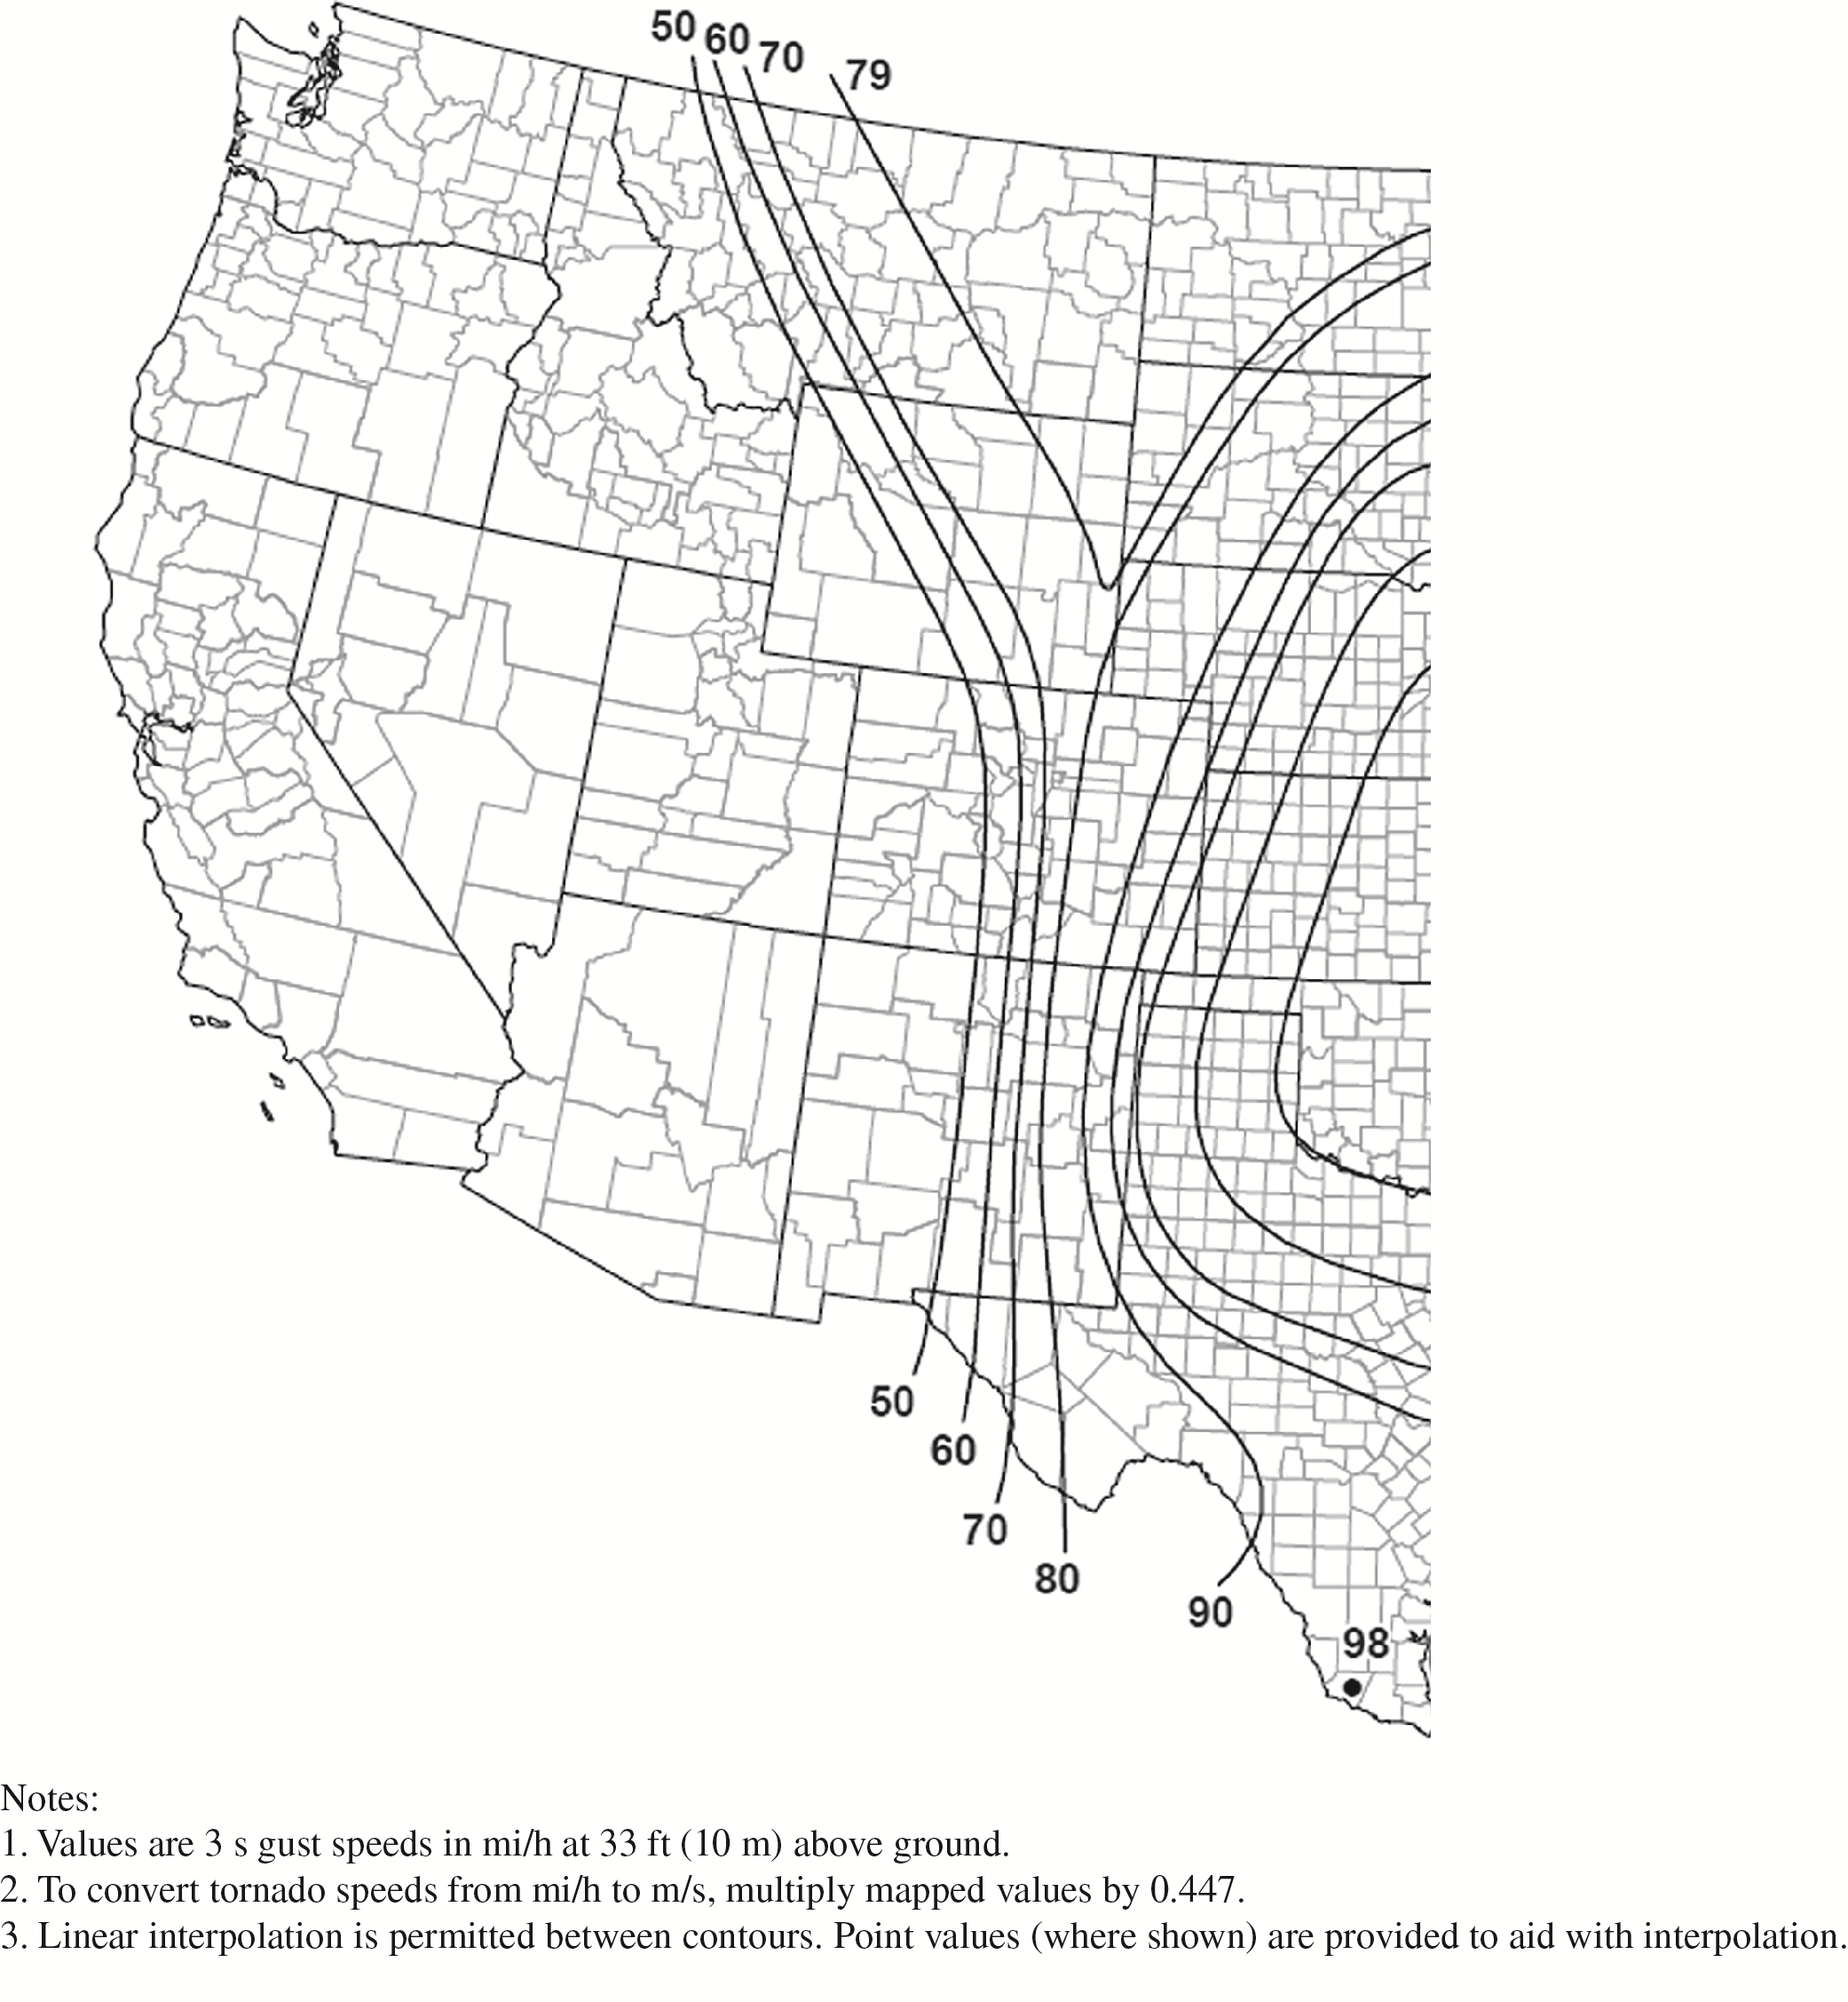
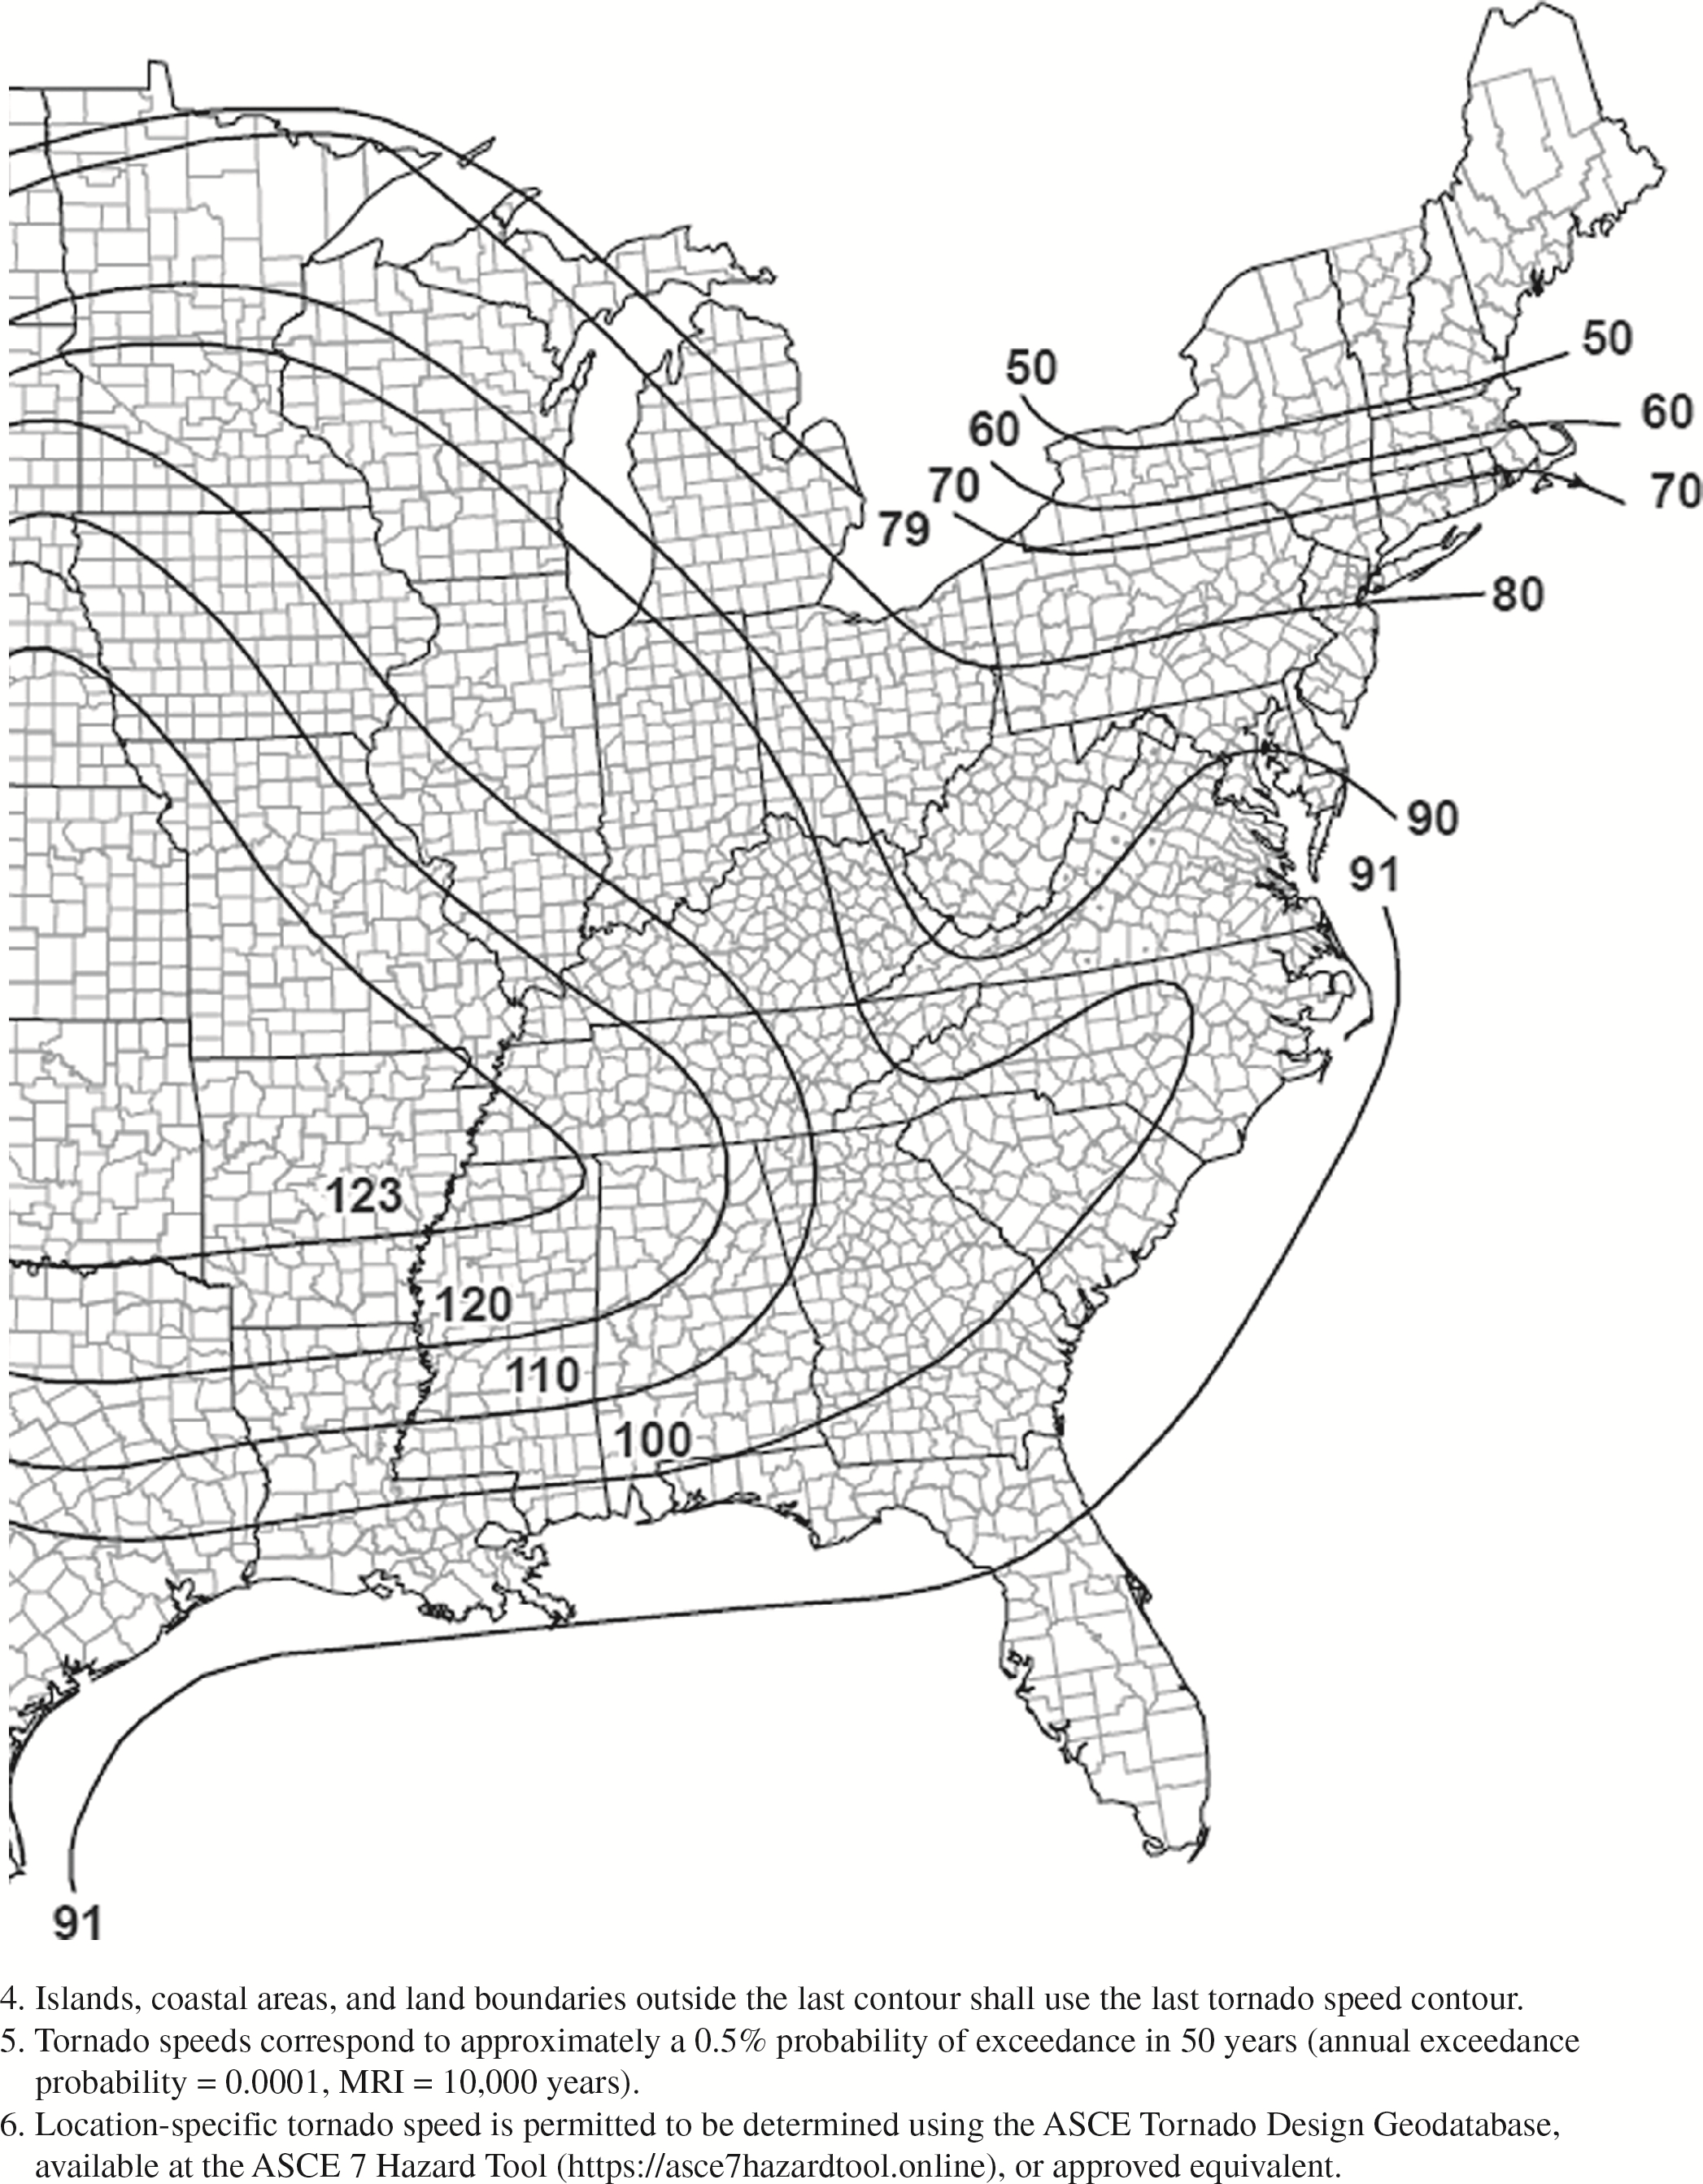
Figure G.2-1B. Tornado speeds for 10,000-year MRI for effective
plan area of 2,000 ft2
(186 m2).
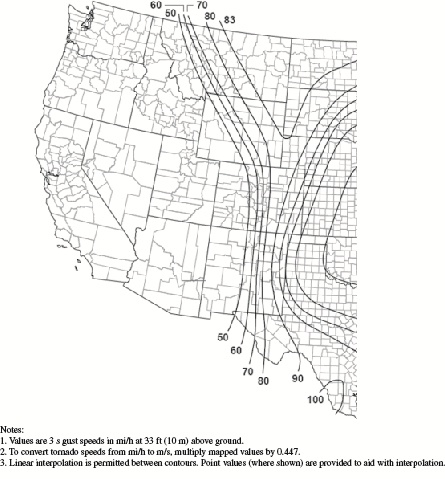
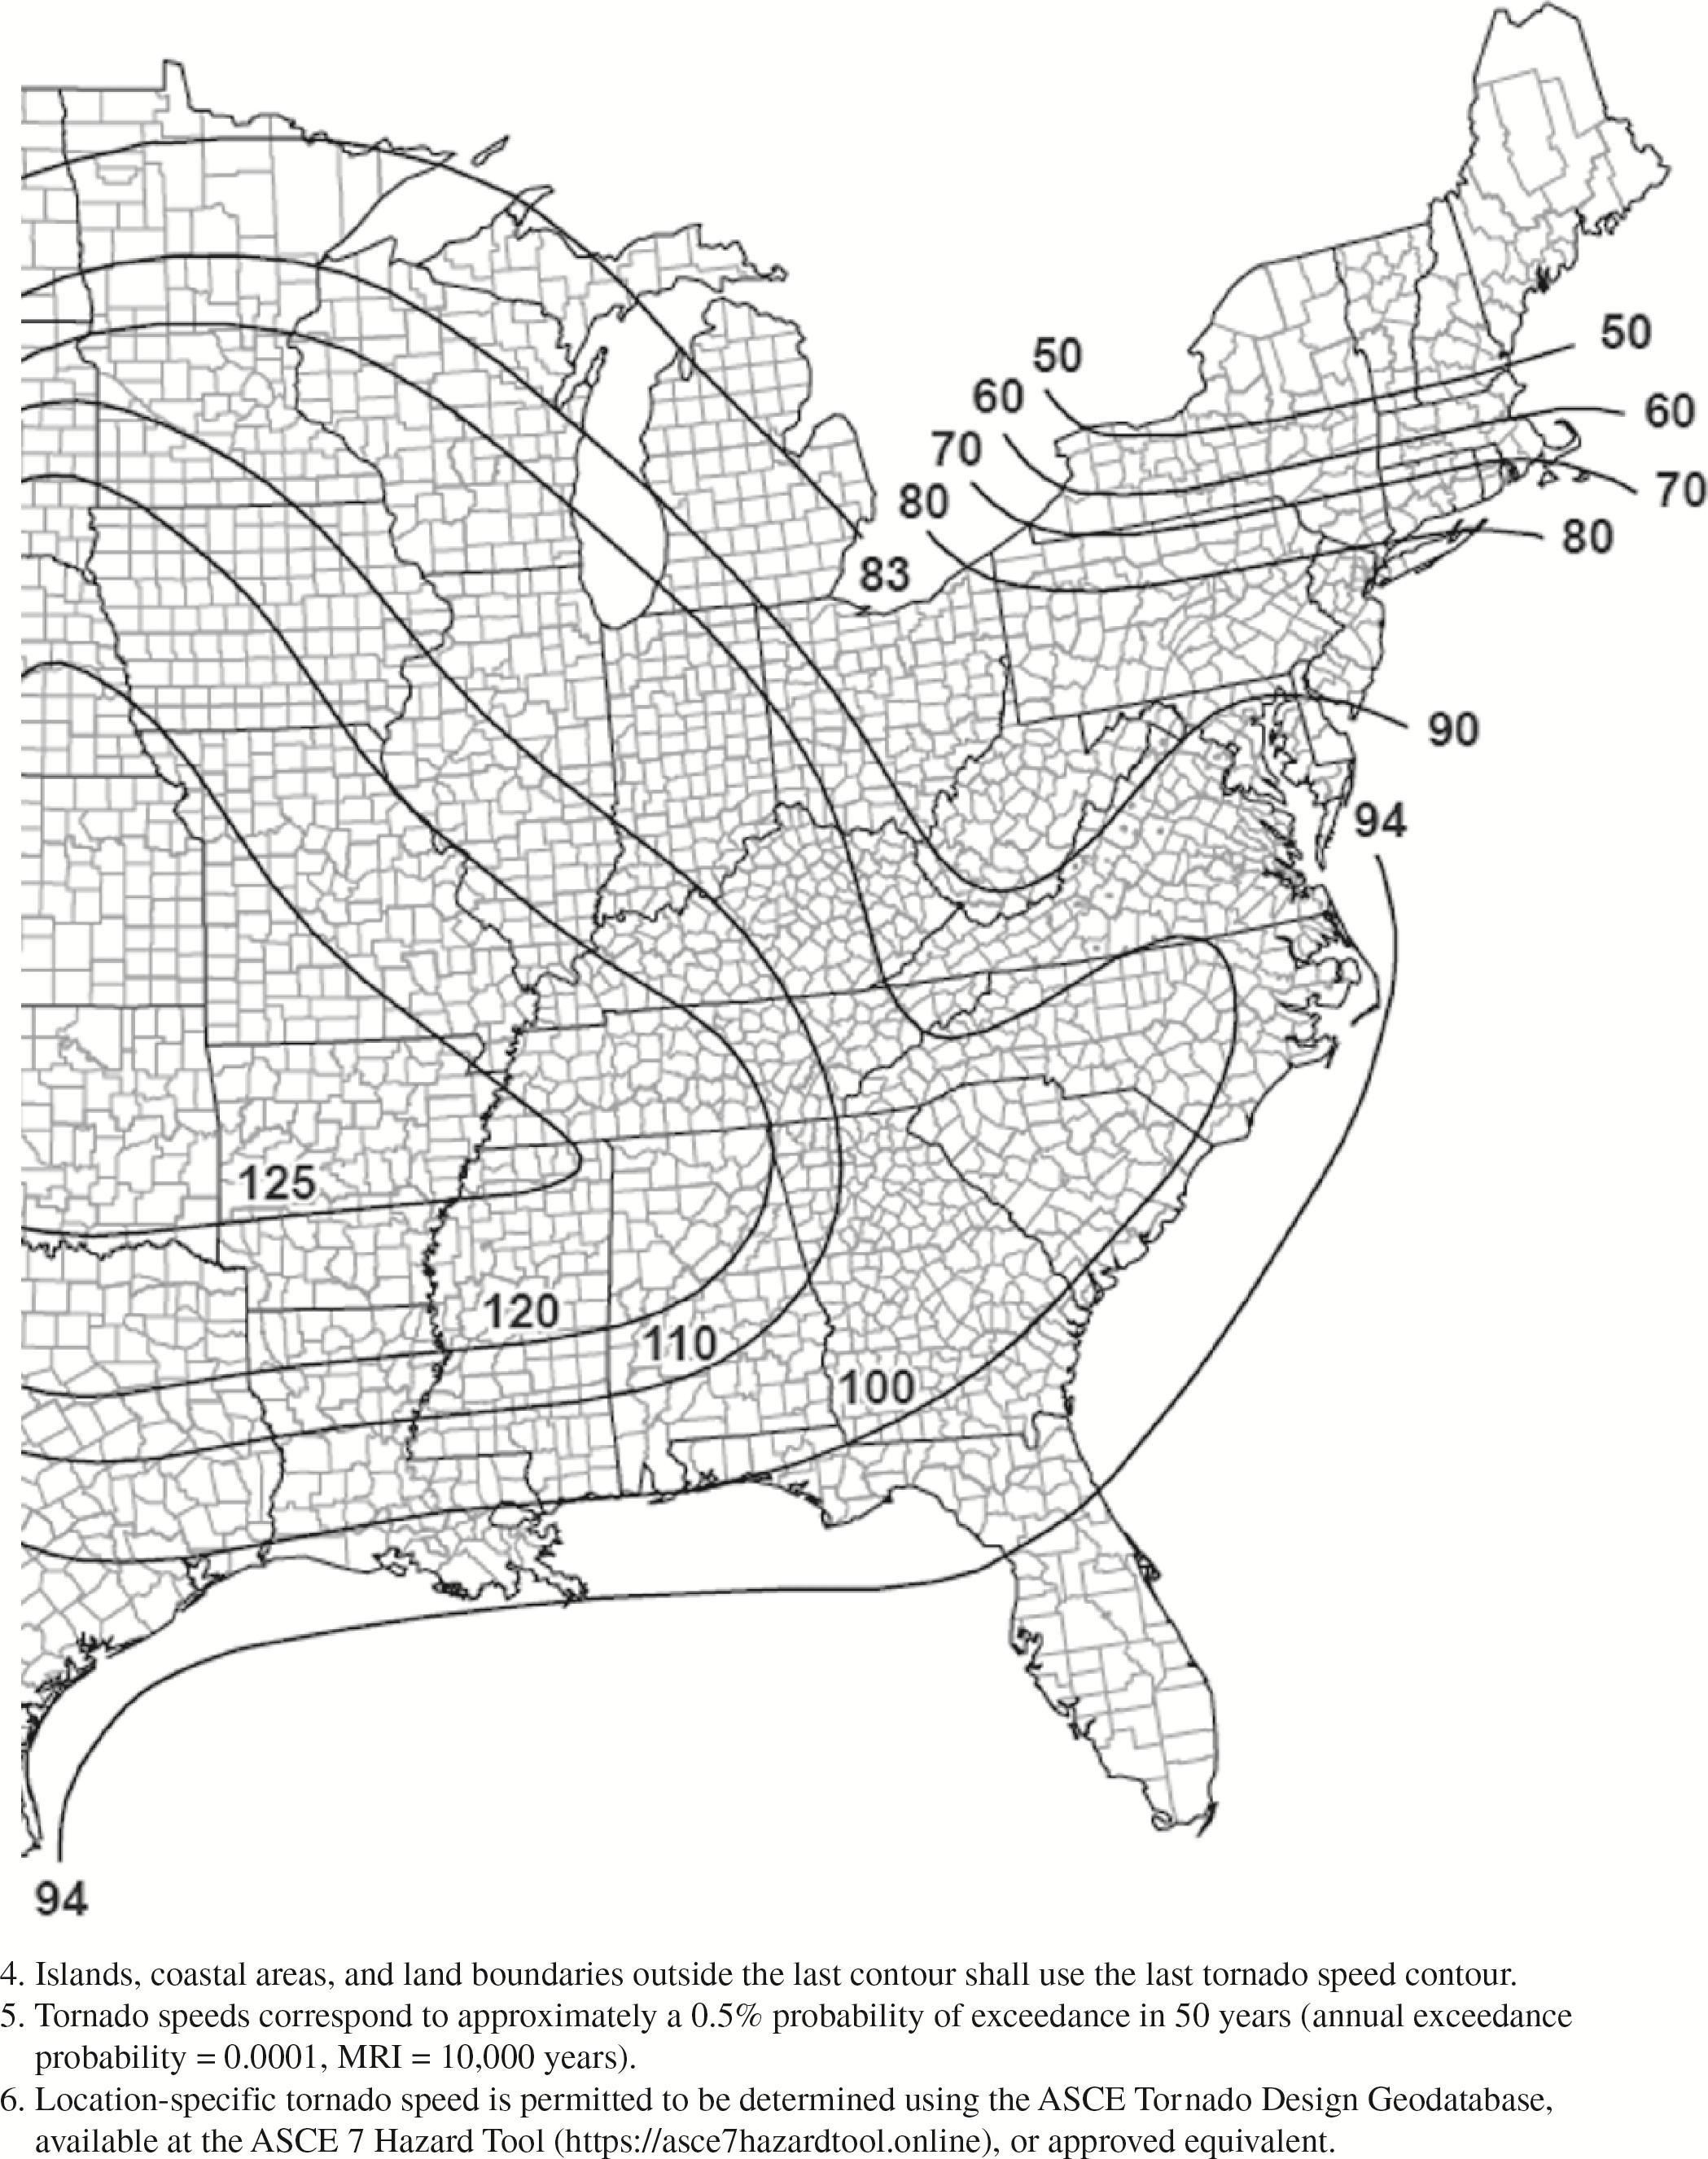
Figure G.2-1C. Tornado speeds for 10,000-year MRI for effective
plan area of 10,000 ft2
(929 m2).
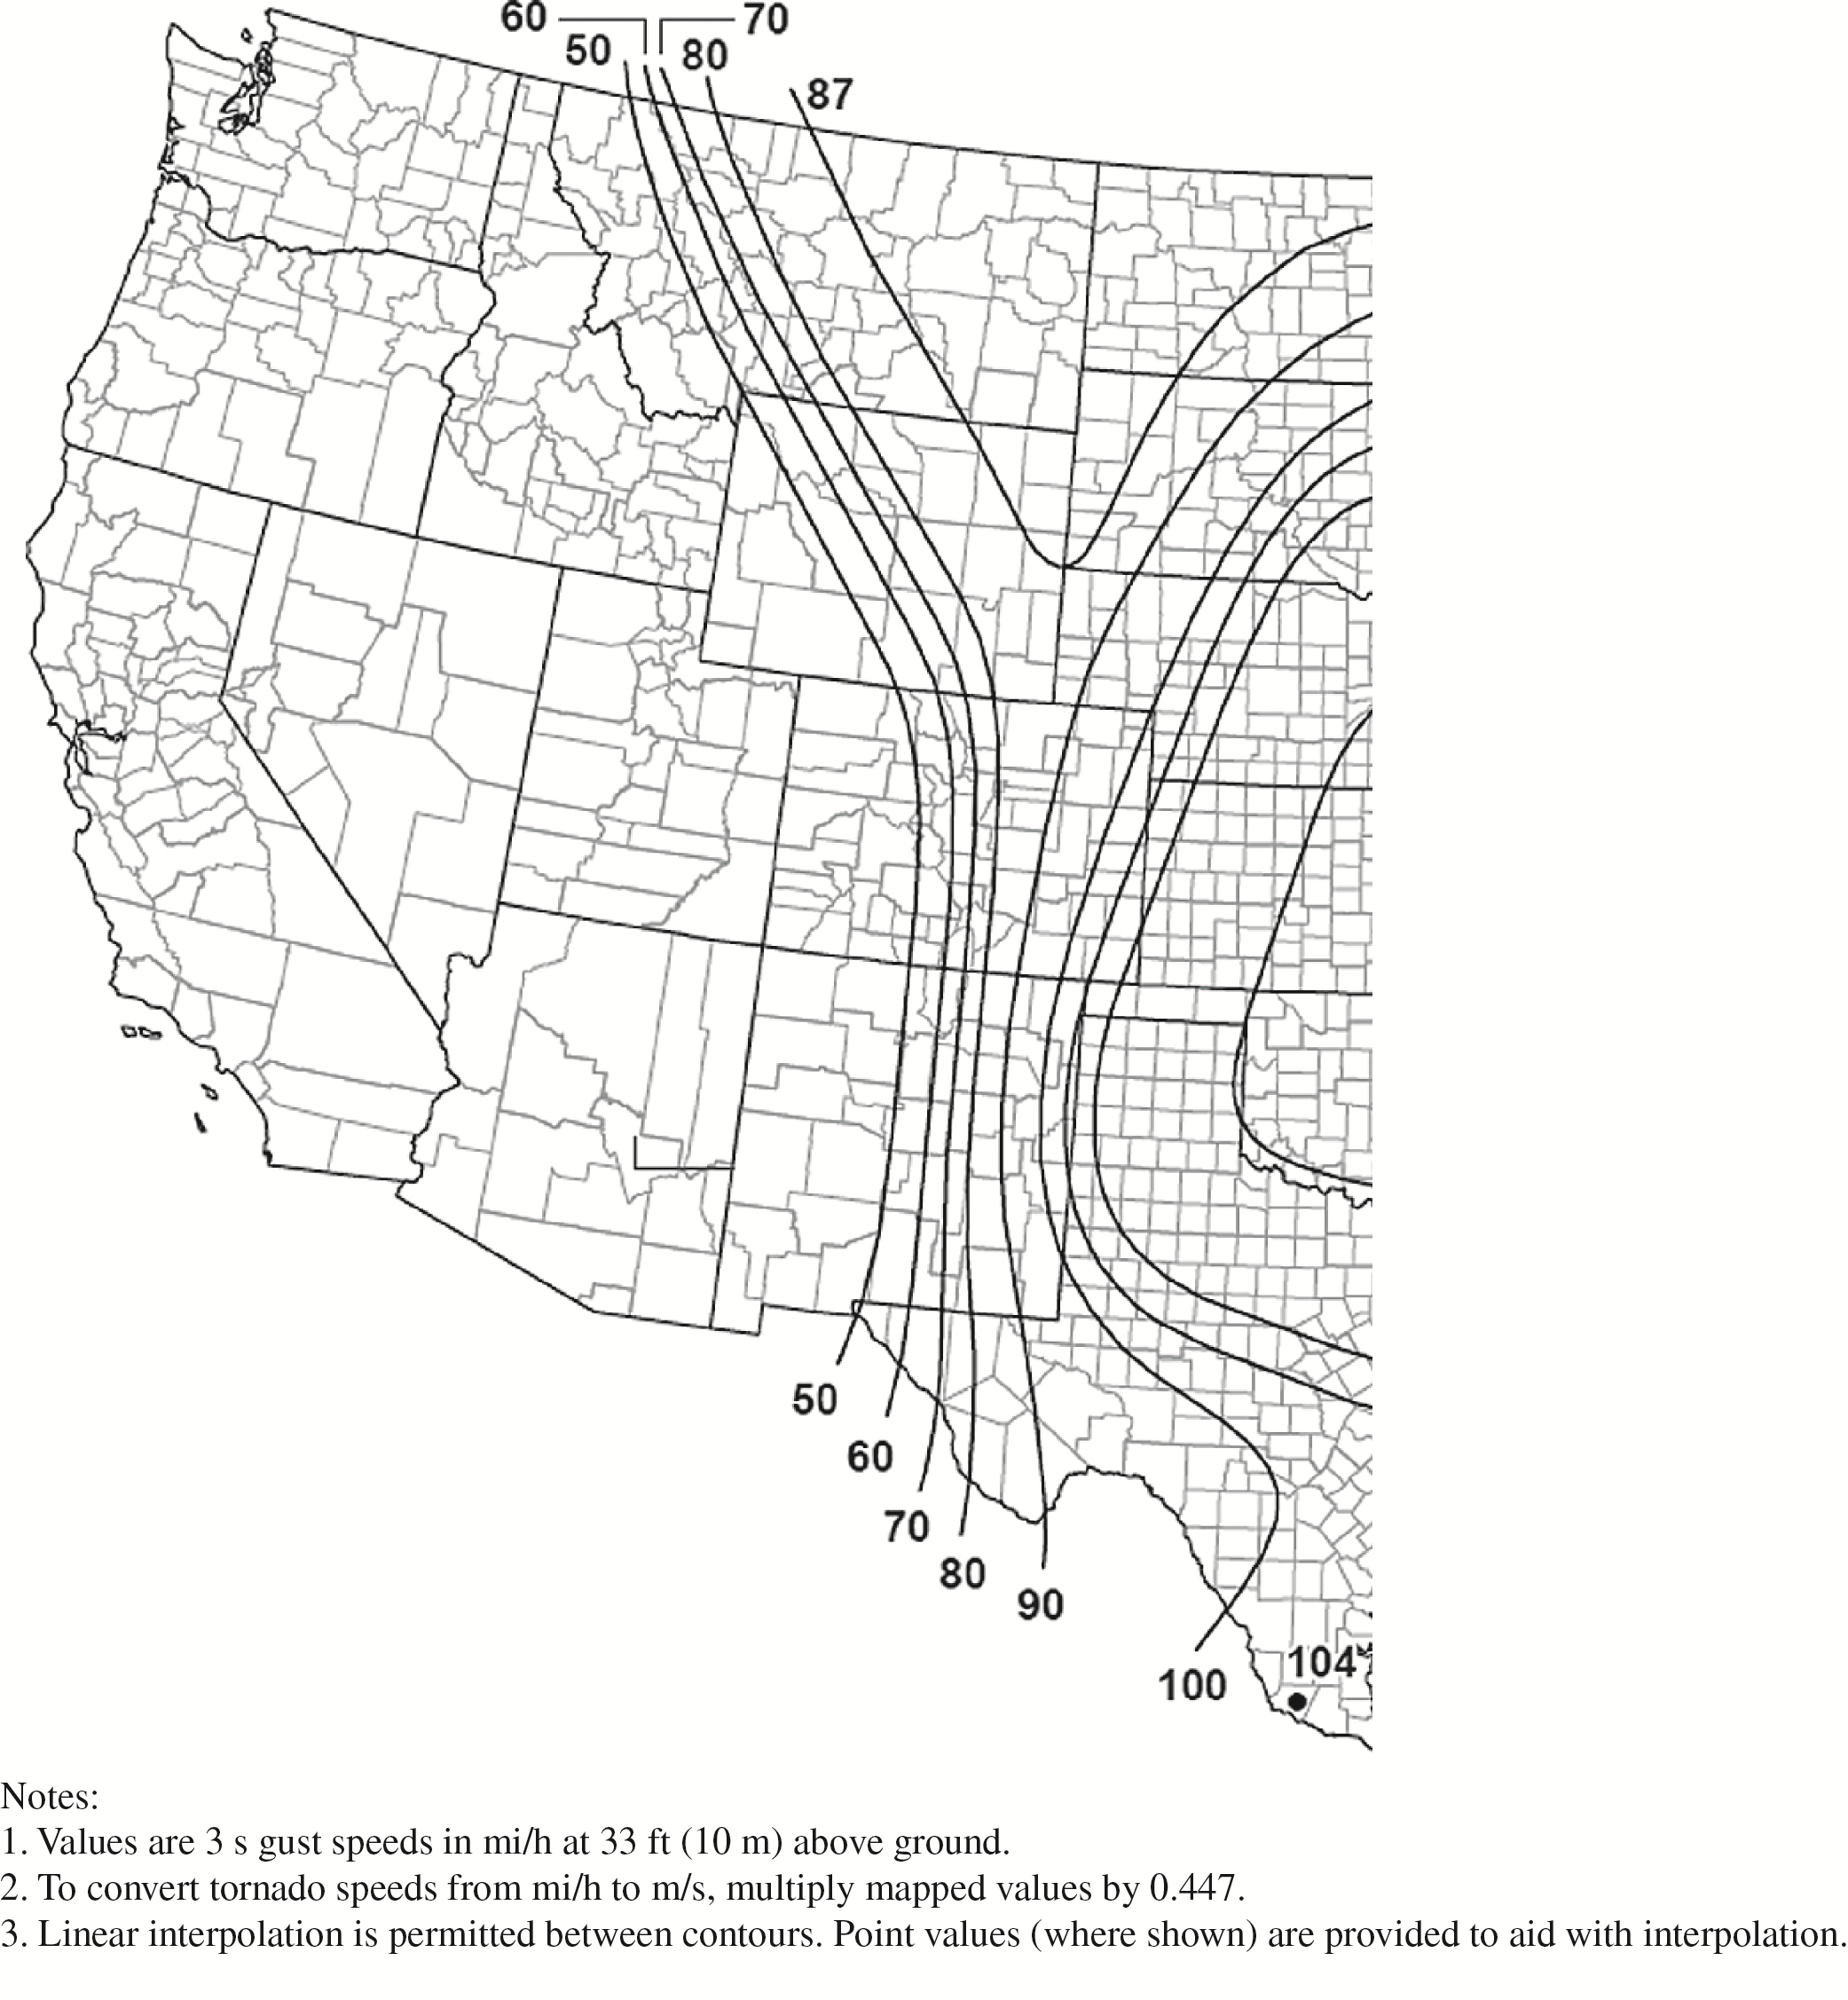
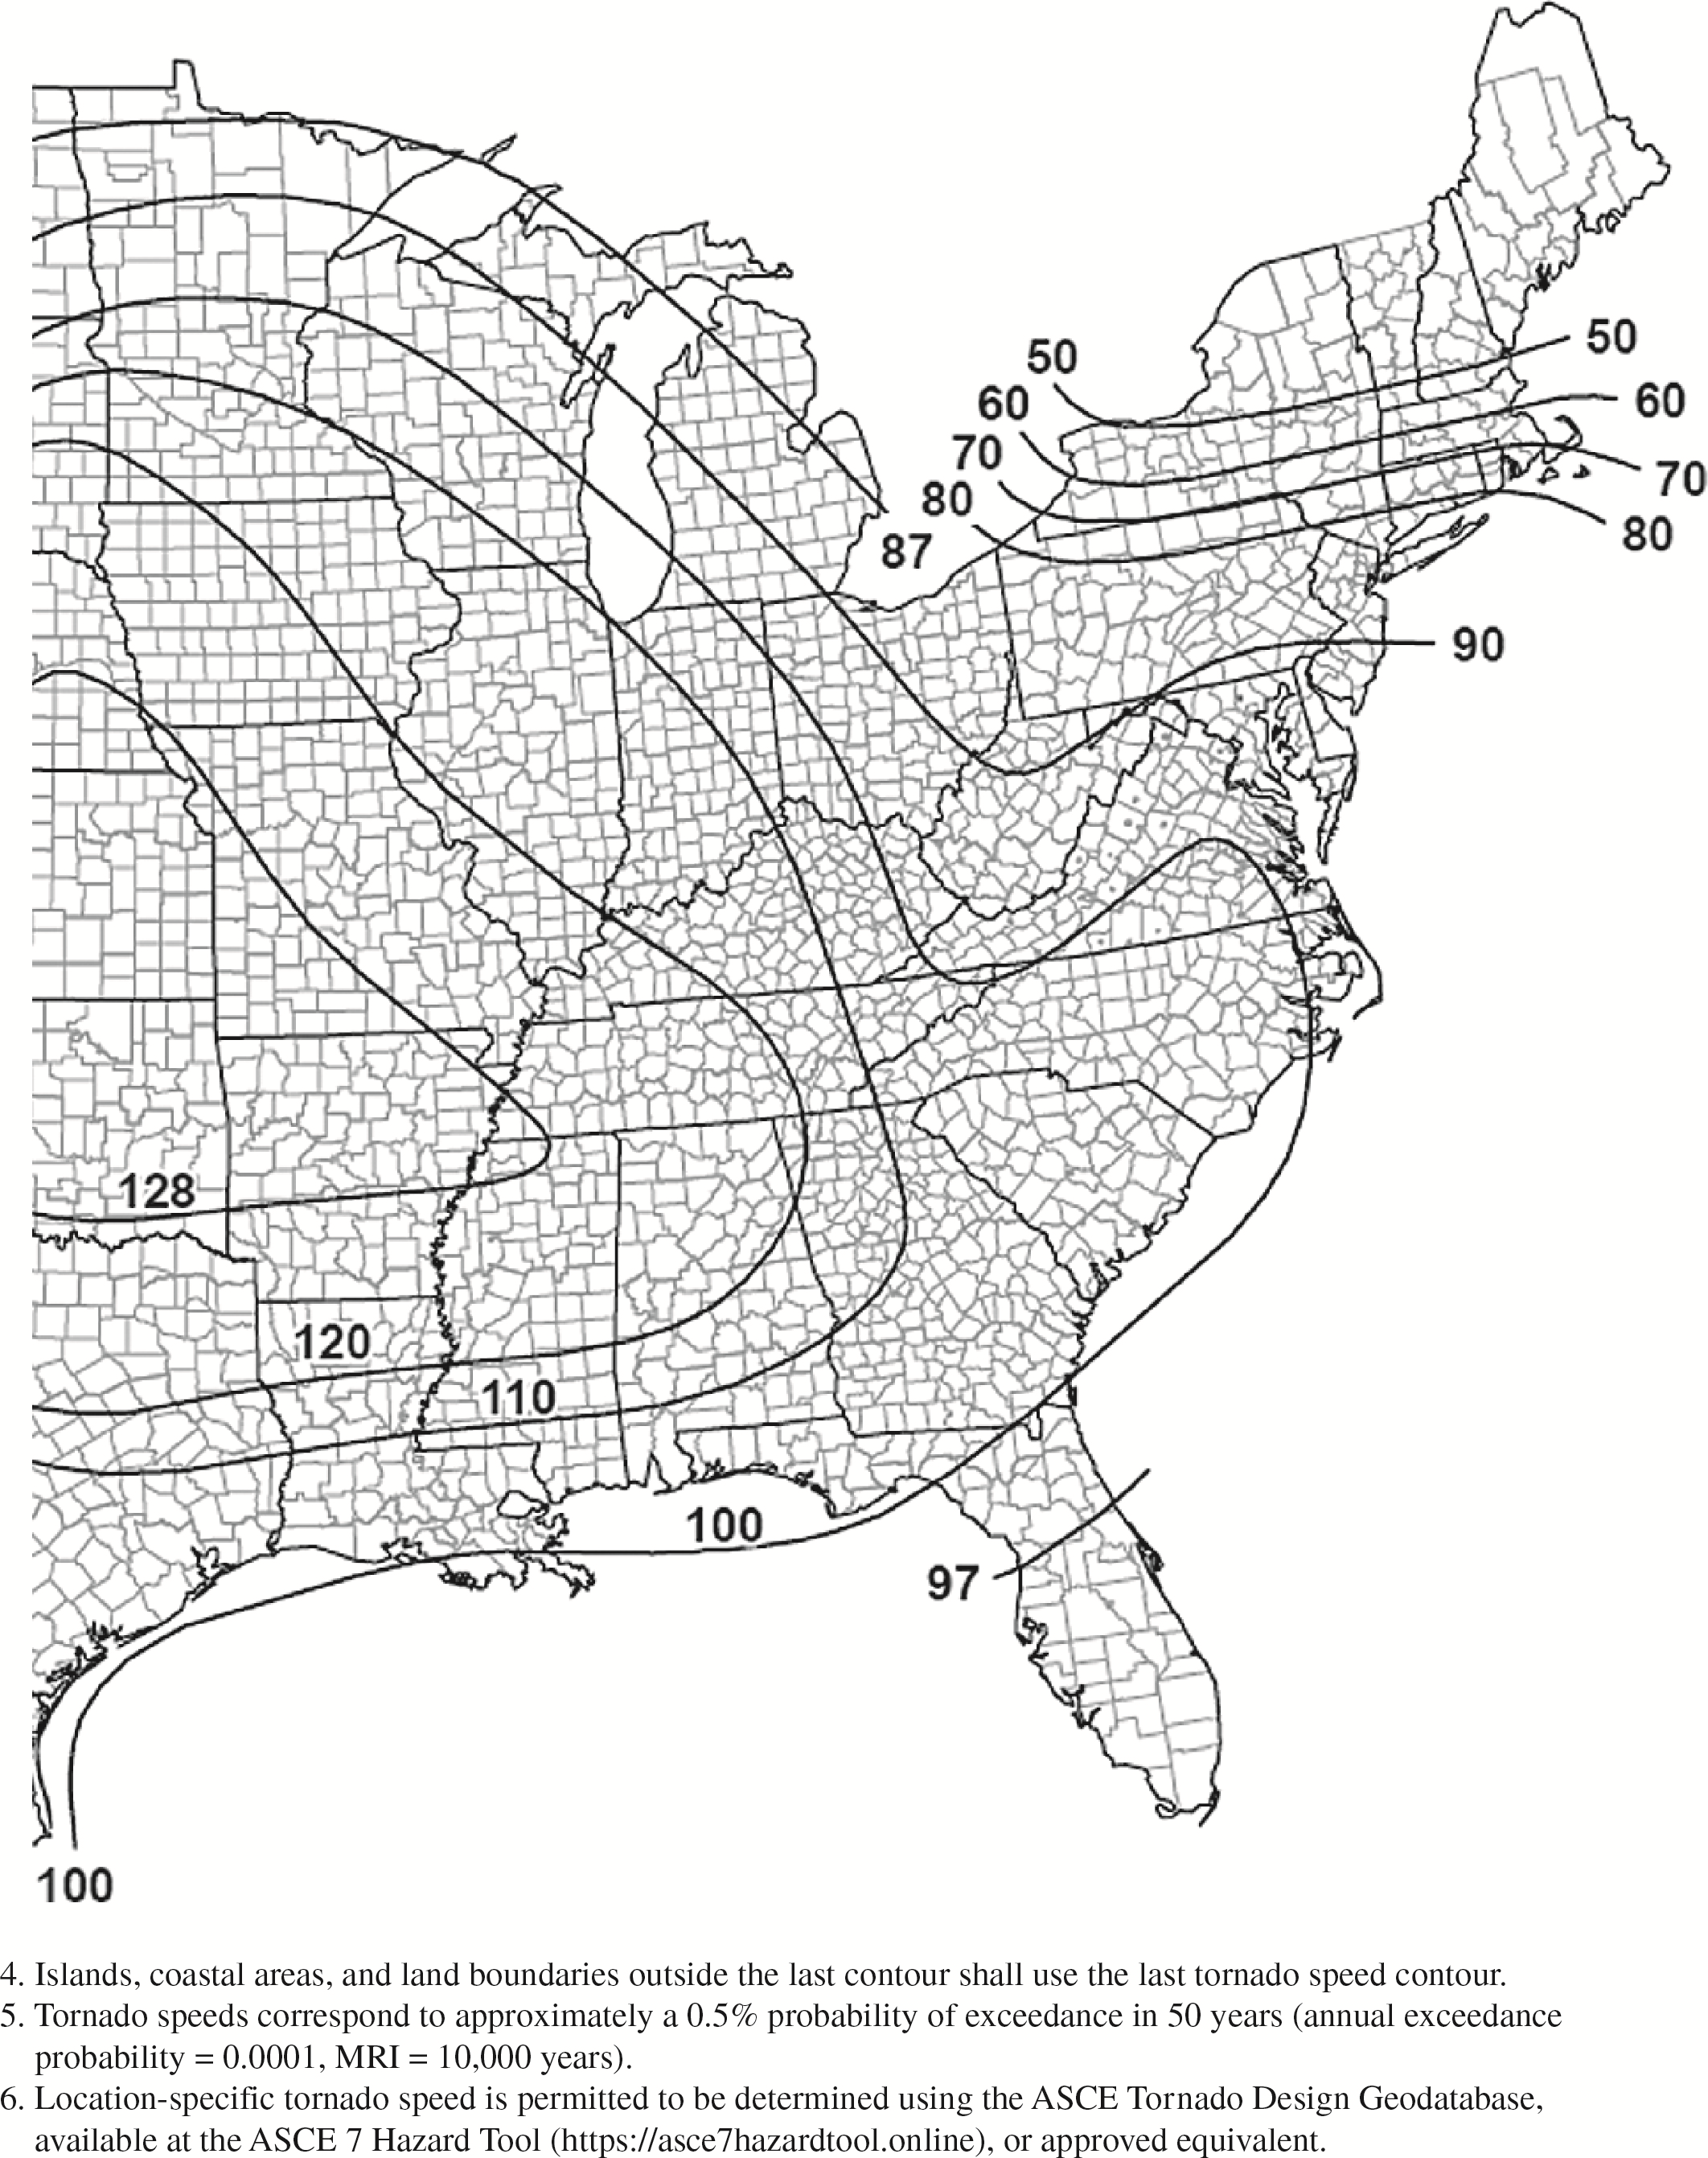
Figure G.2-1D. Tornado speeds for 10,000-year MRI for effective
plan area of 40,000 ft2
(3,716 m2).
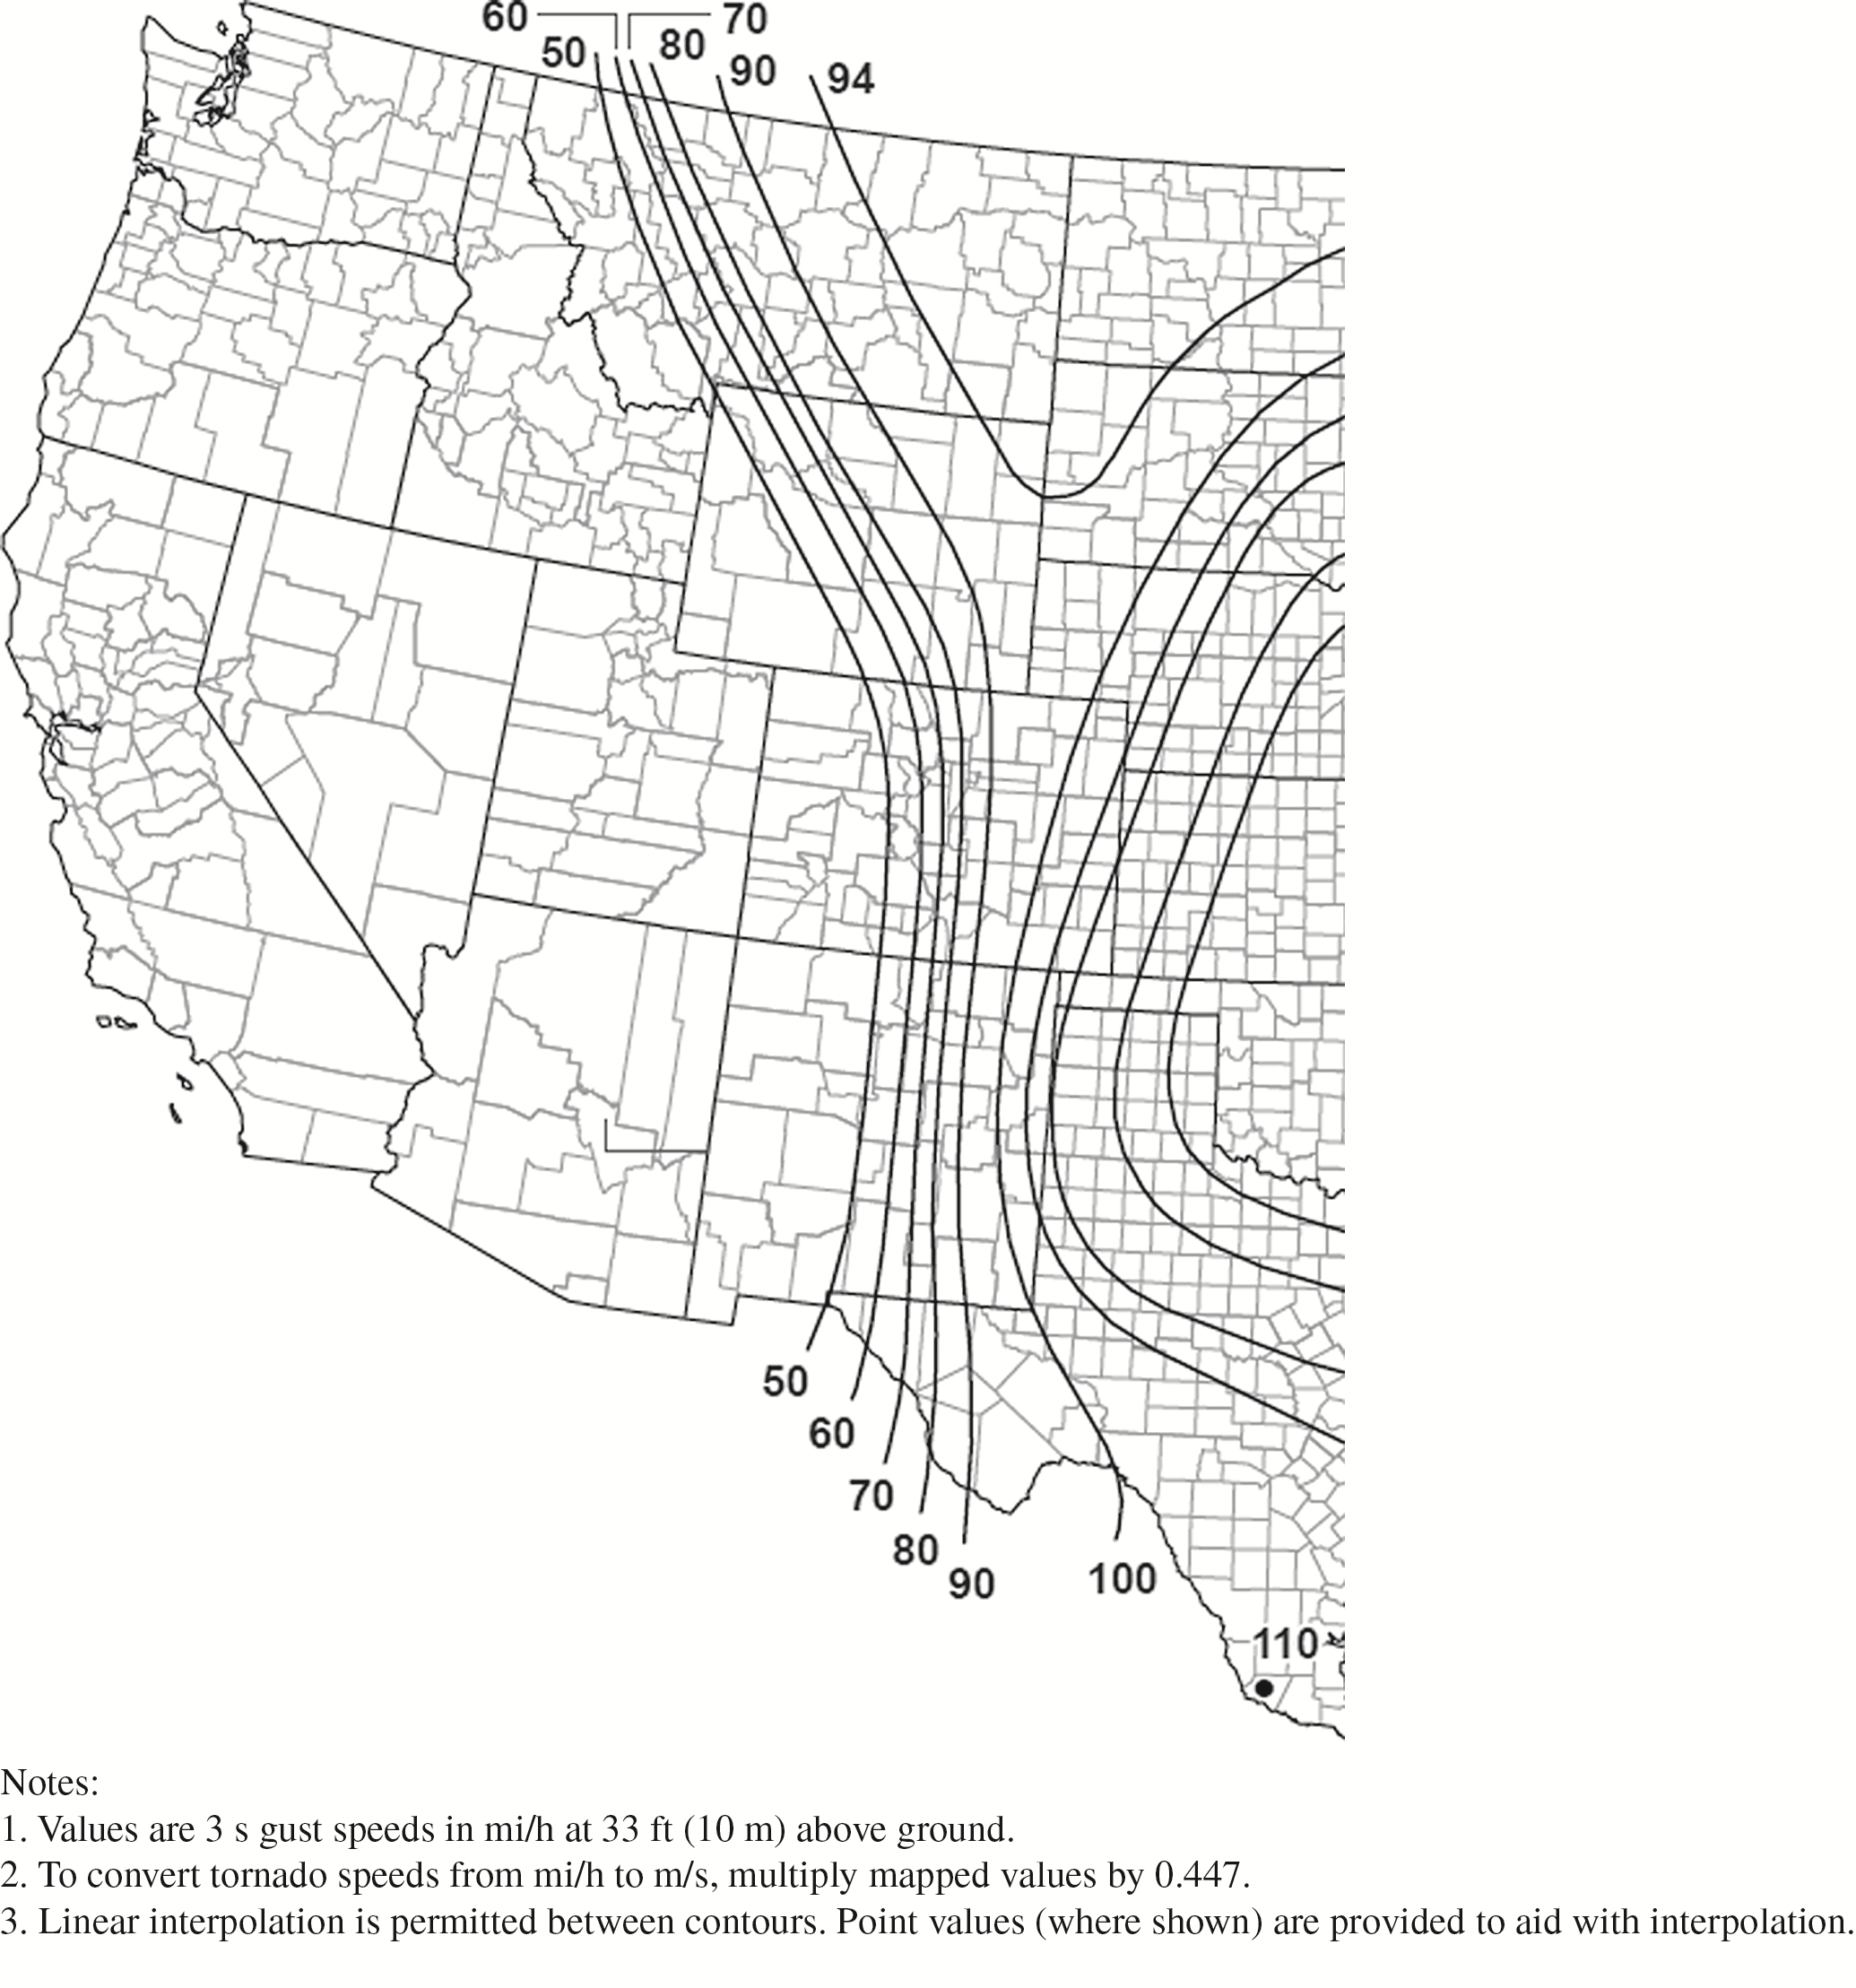
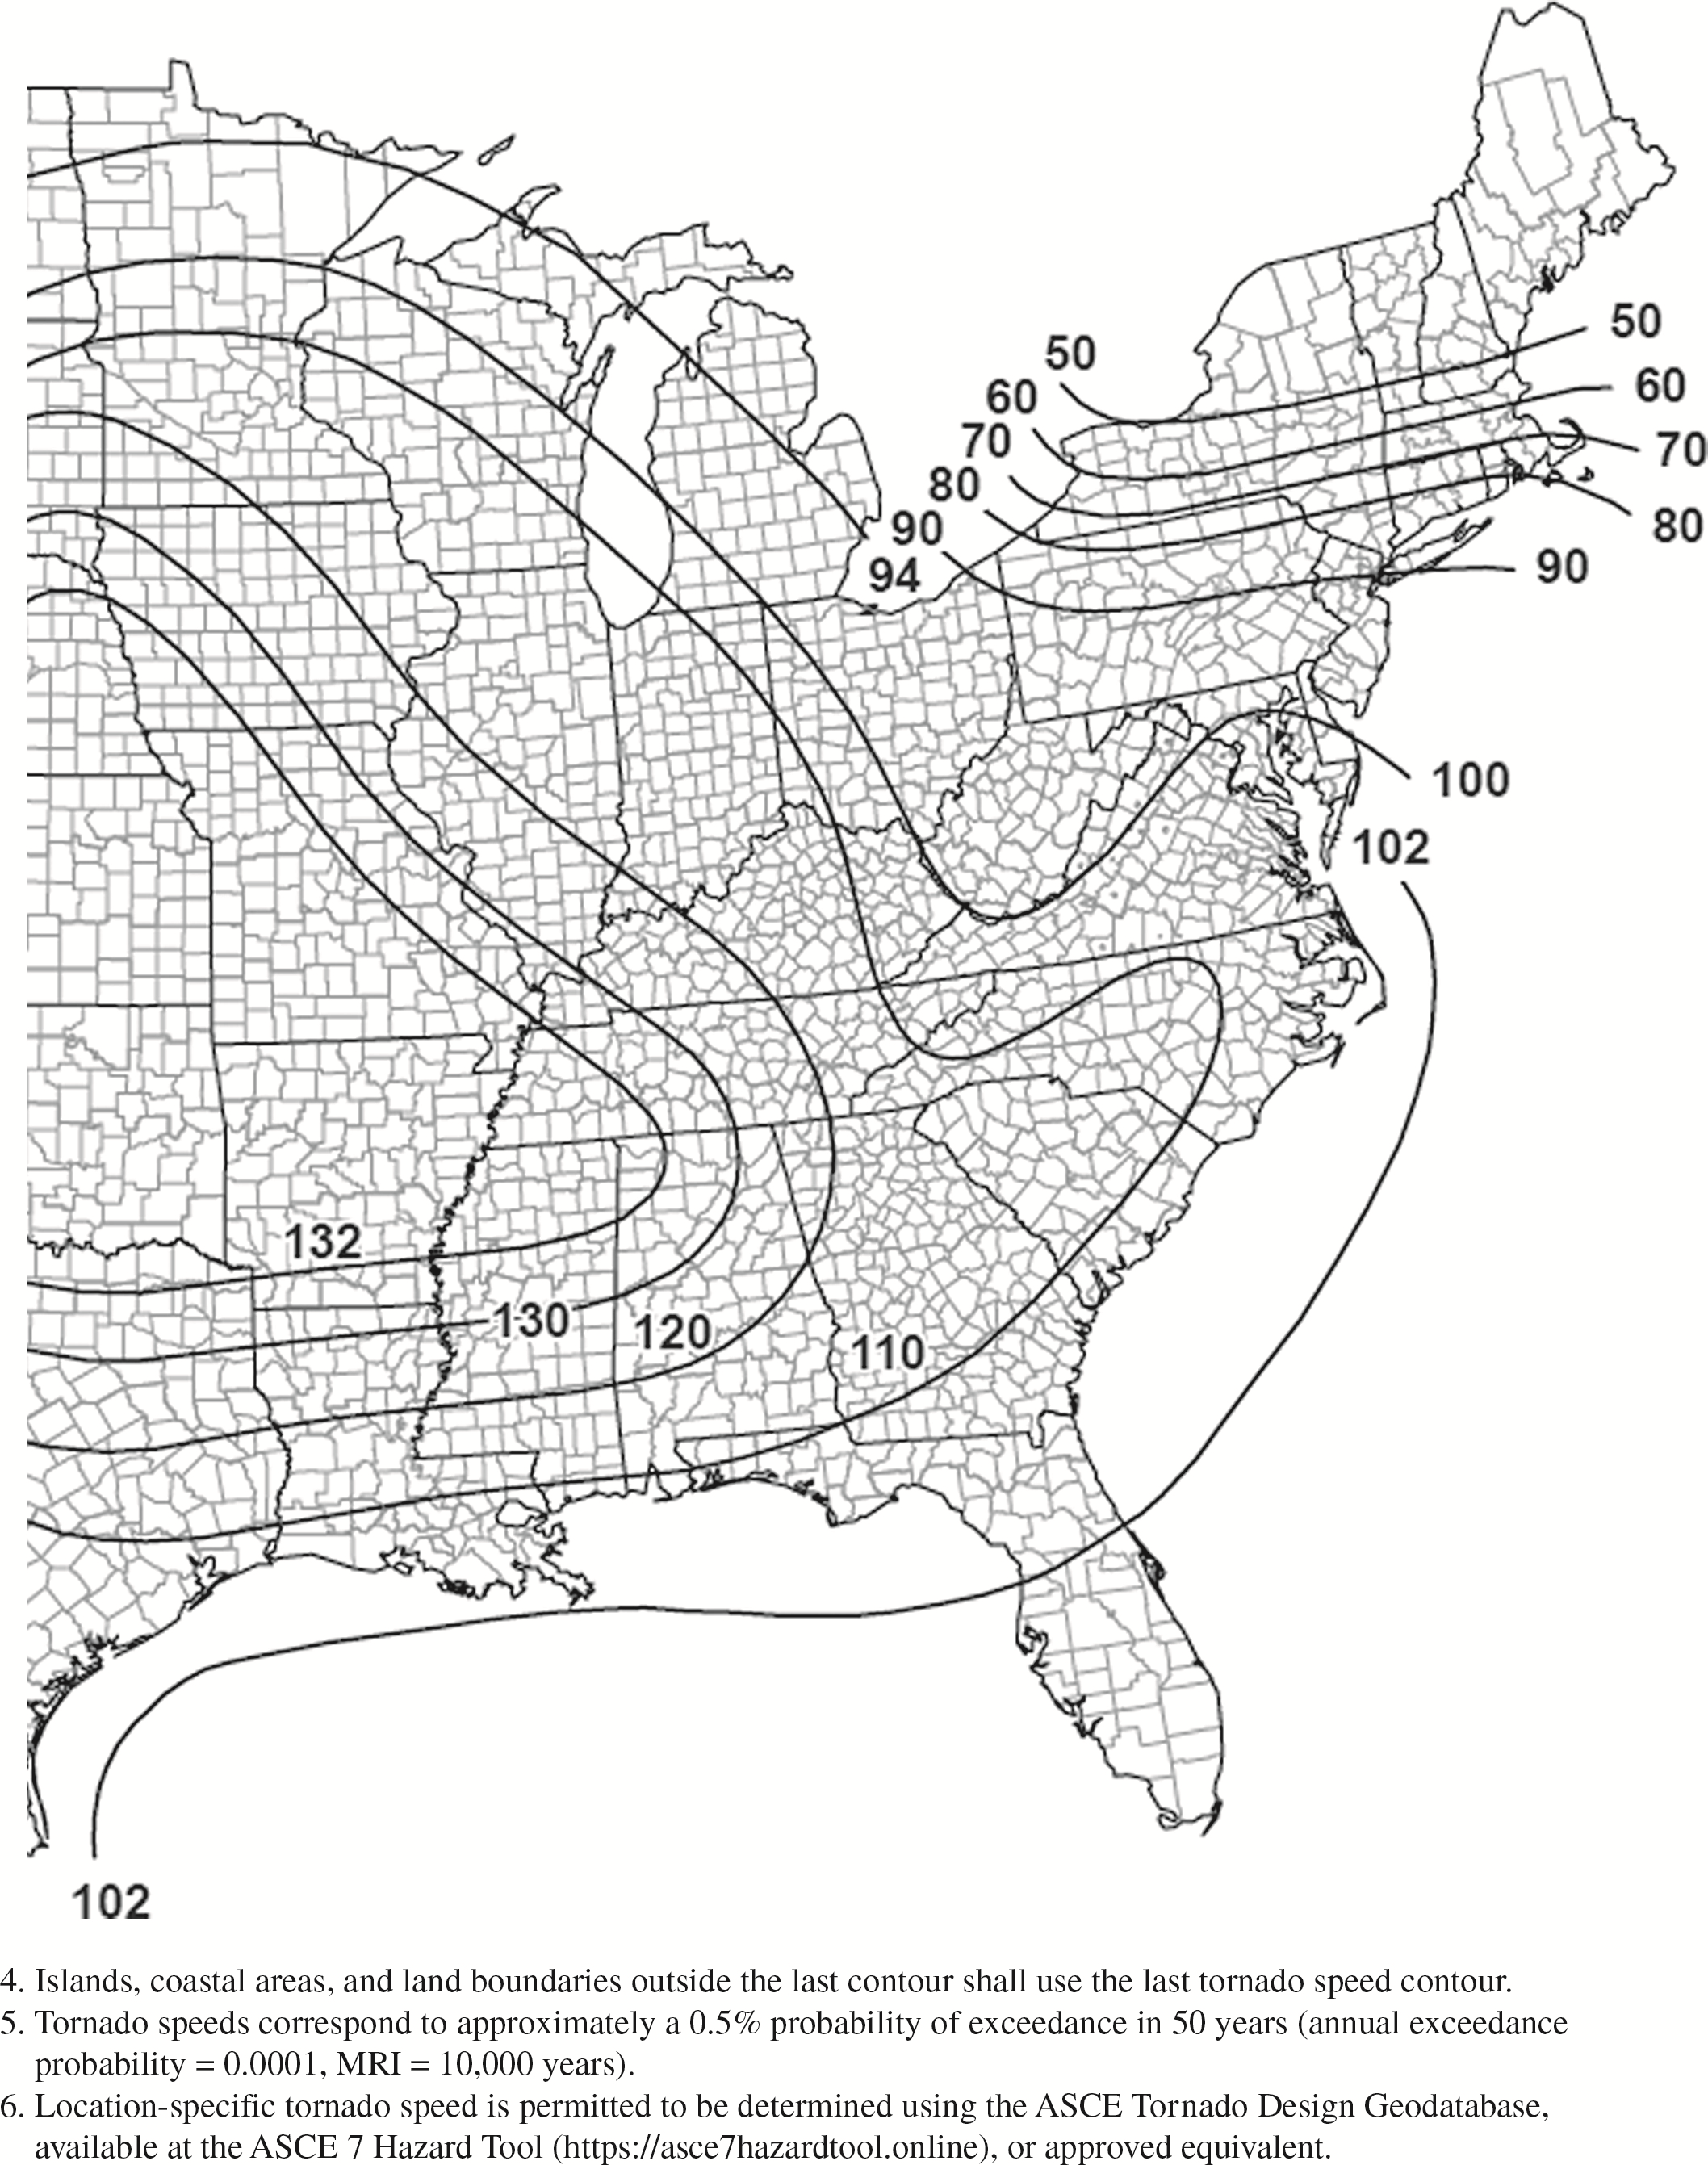
Figure G.2-1E. Tornado speeds for 10,000-year MRI for effective
plan area of 100,000 ft2
(9,290 m2).

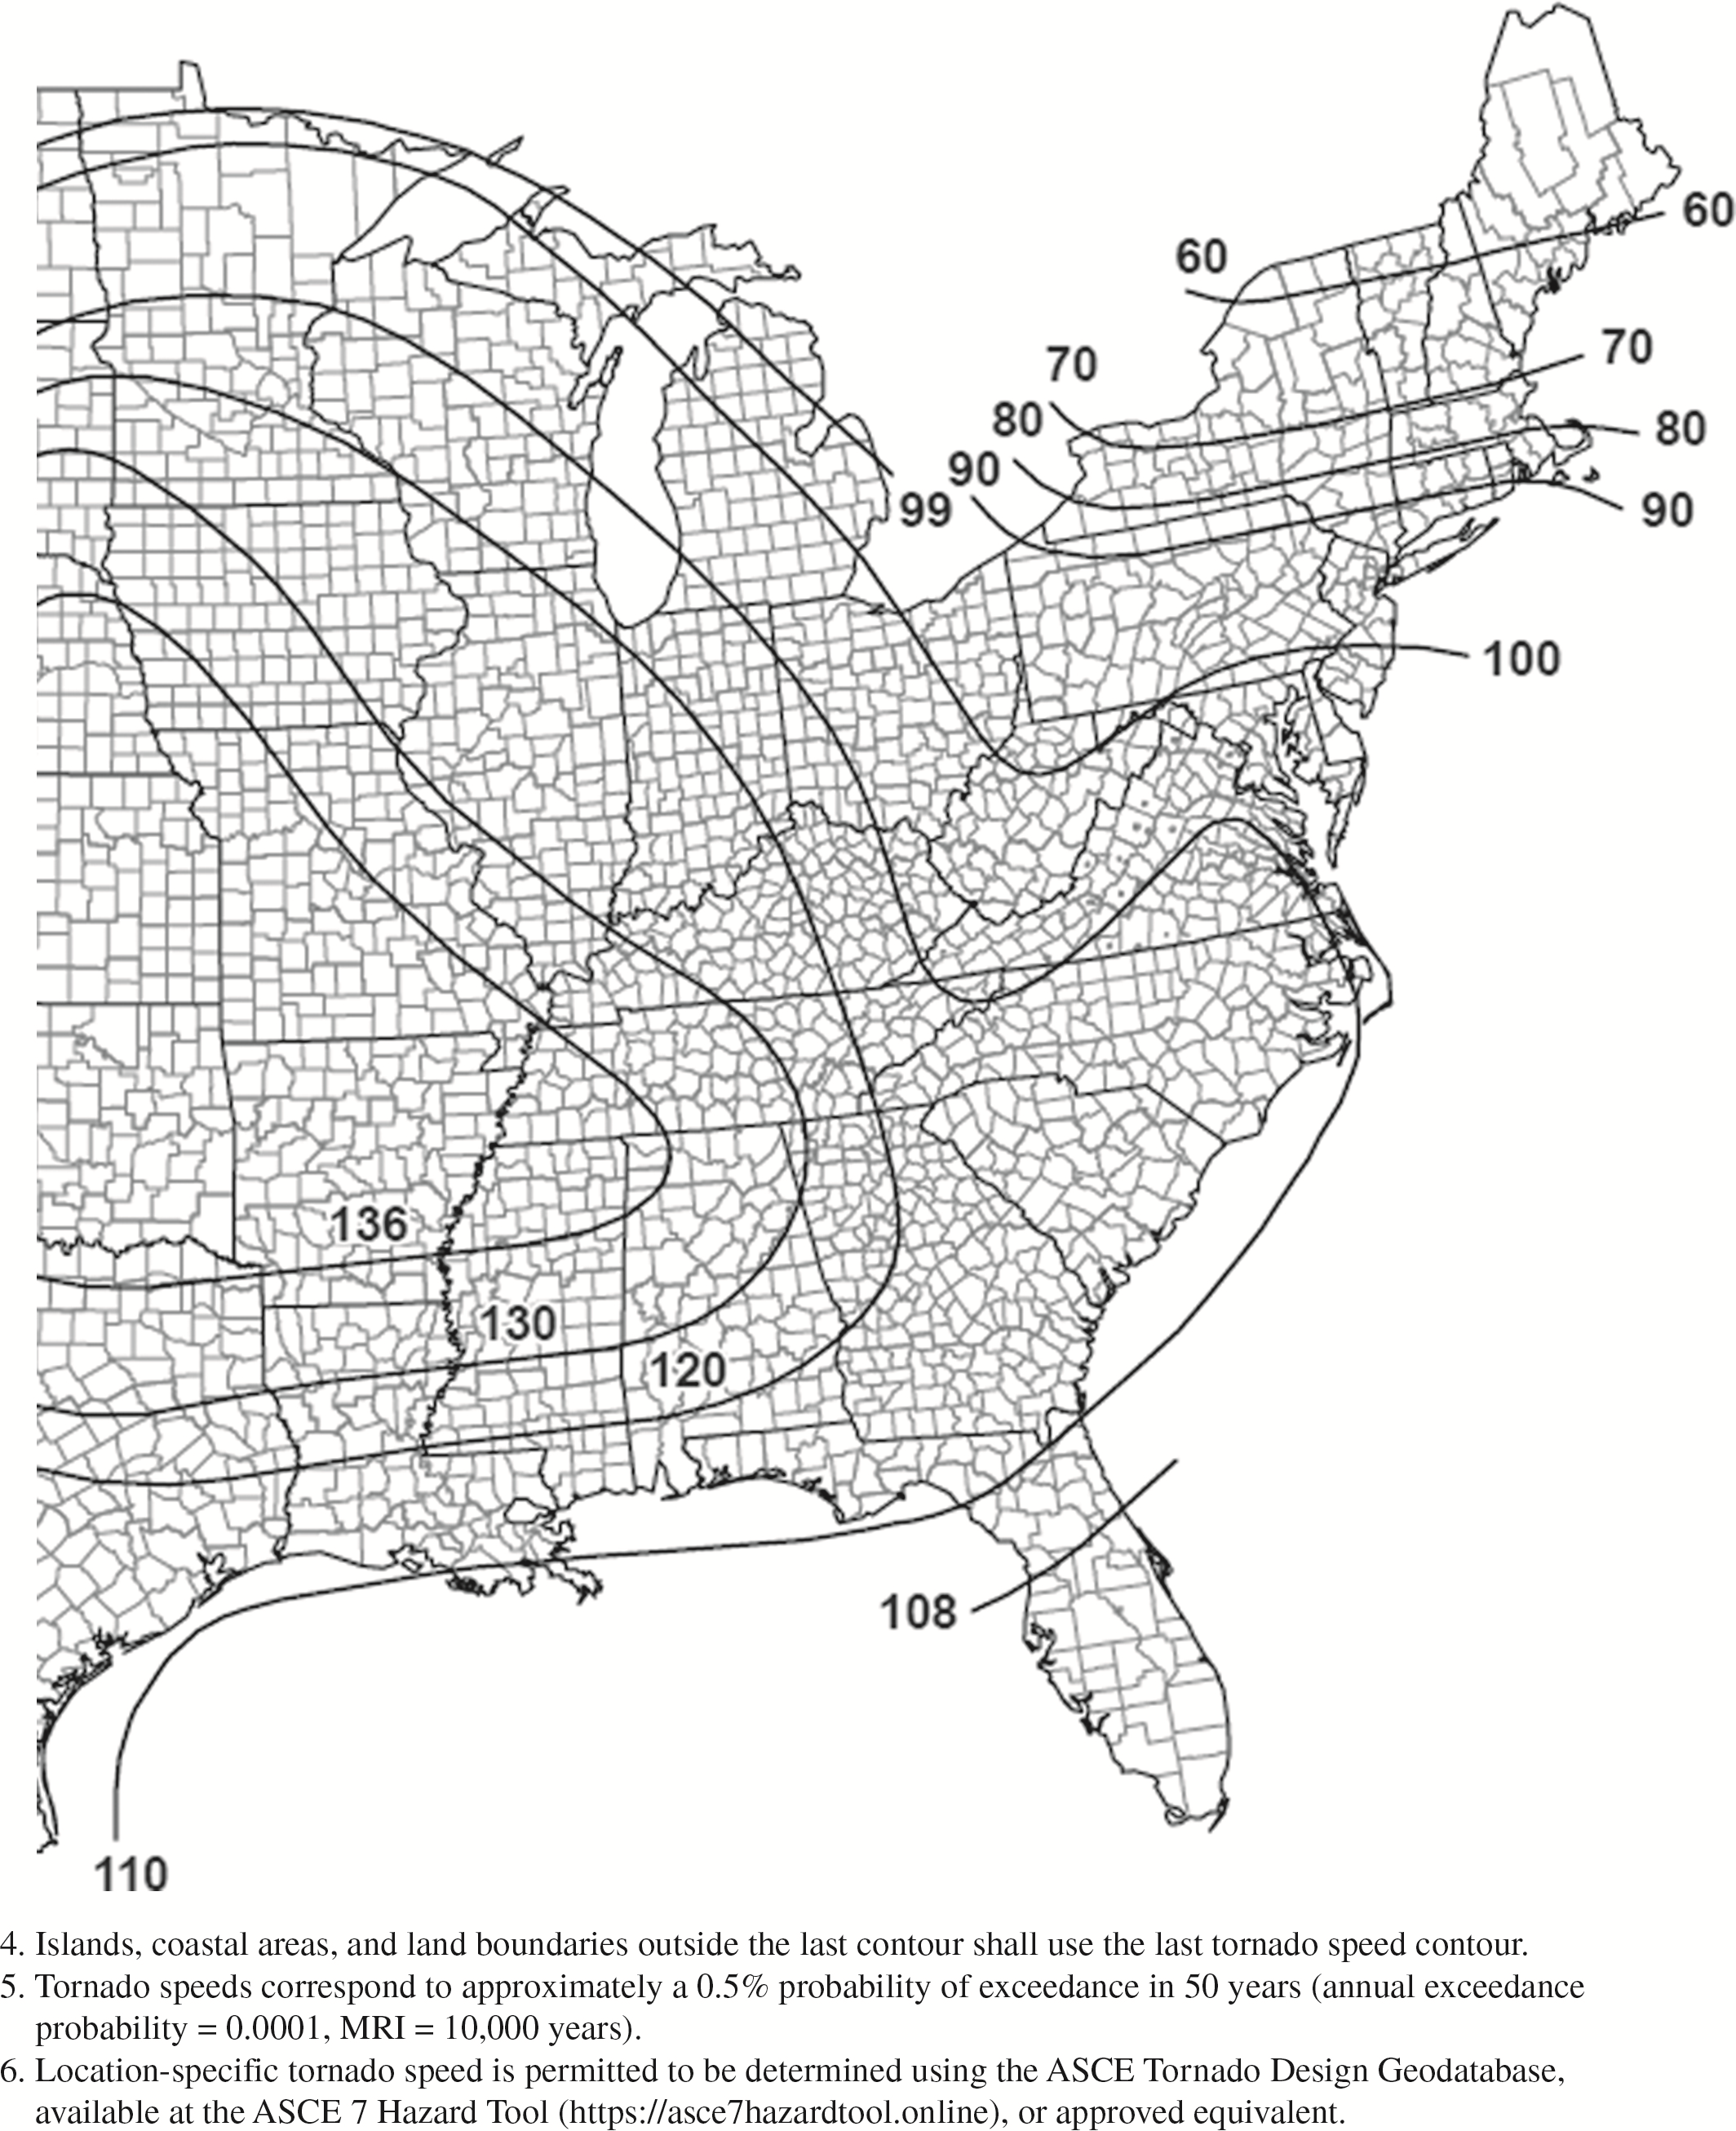
Figure G.2-1F. Tornado speeds for 10,000-year MRI for effective
plan area of 250,000 ft2
(23,226
m2).
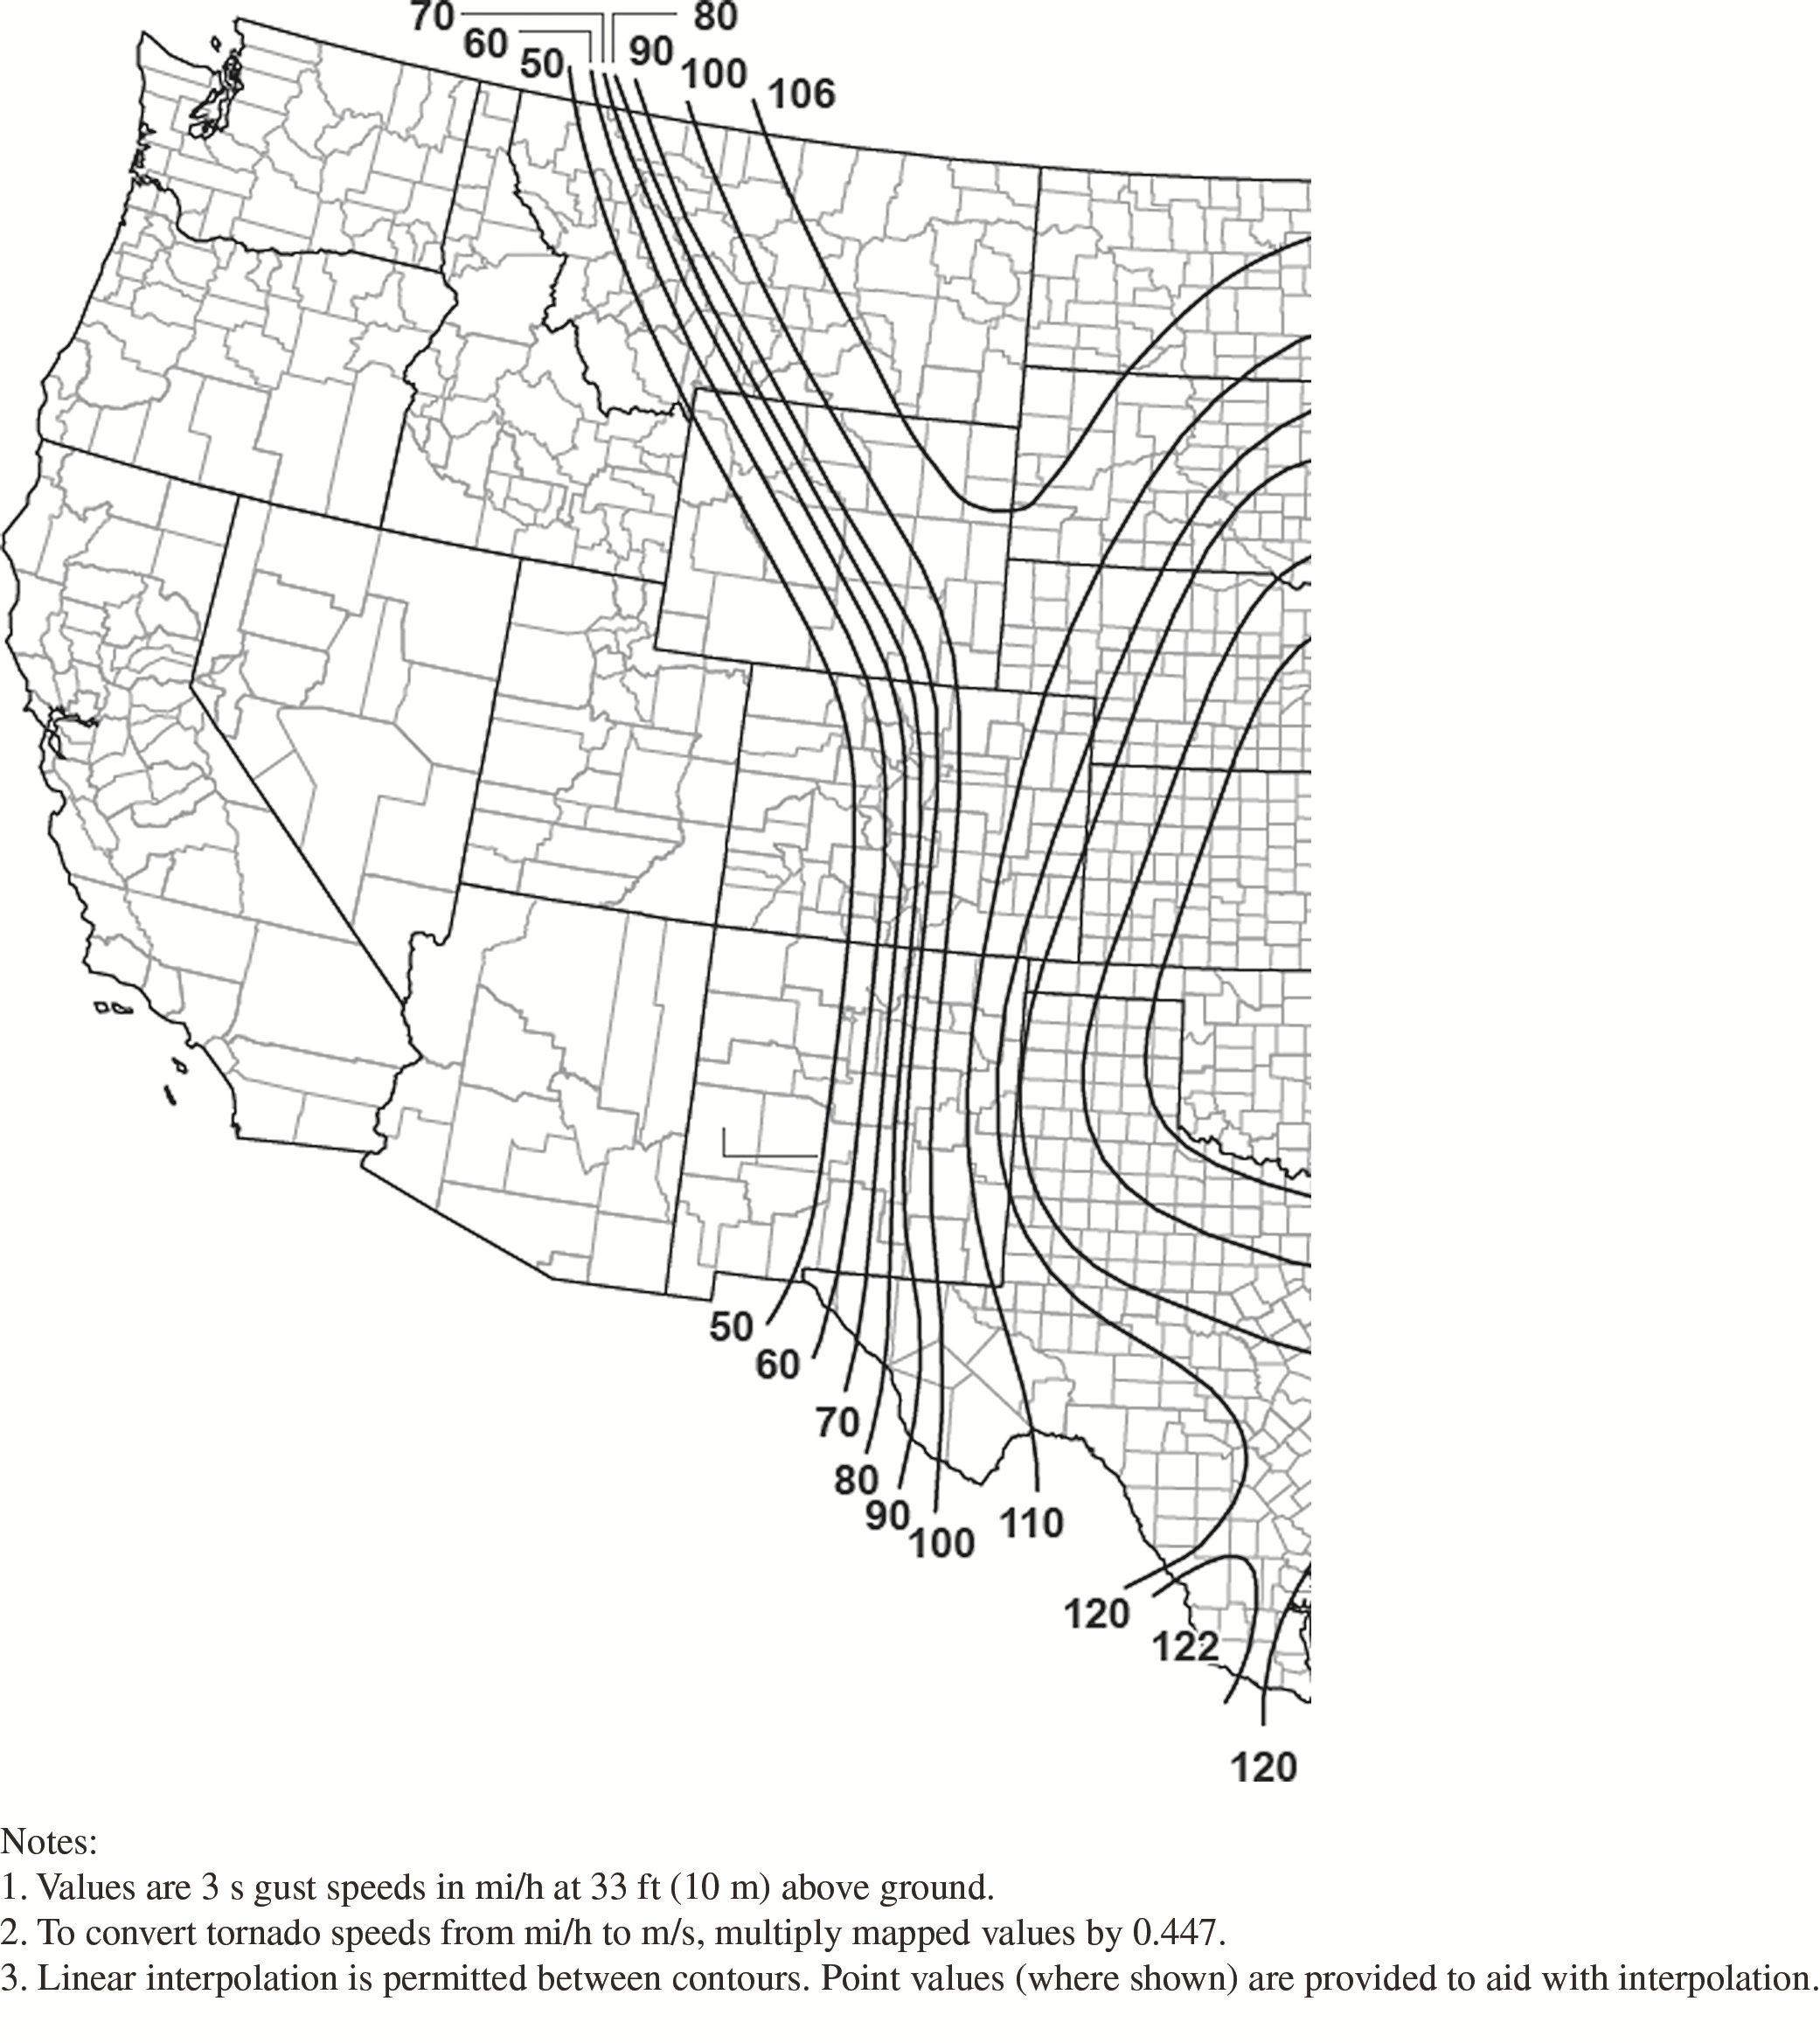
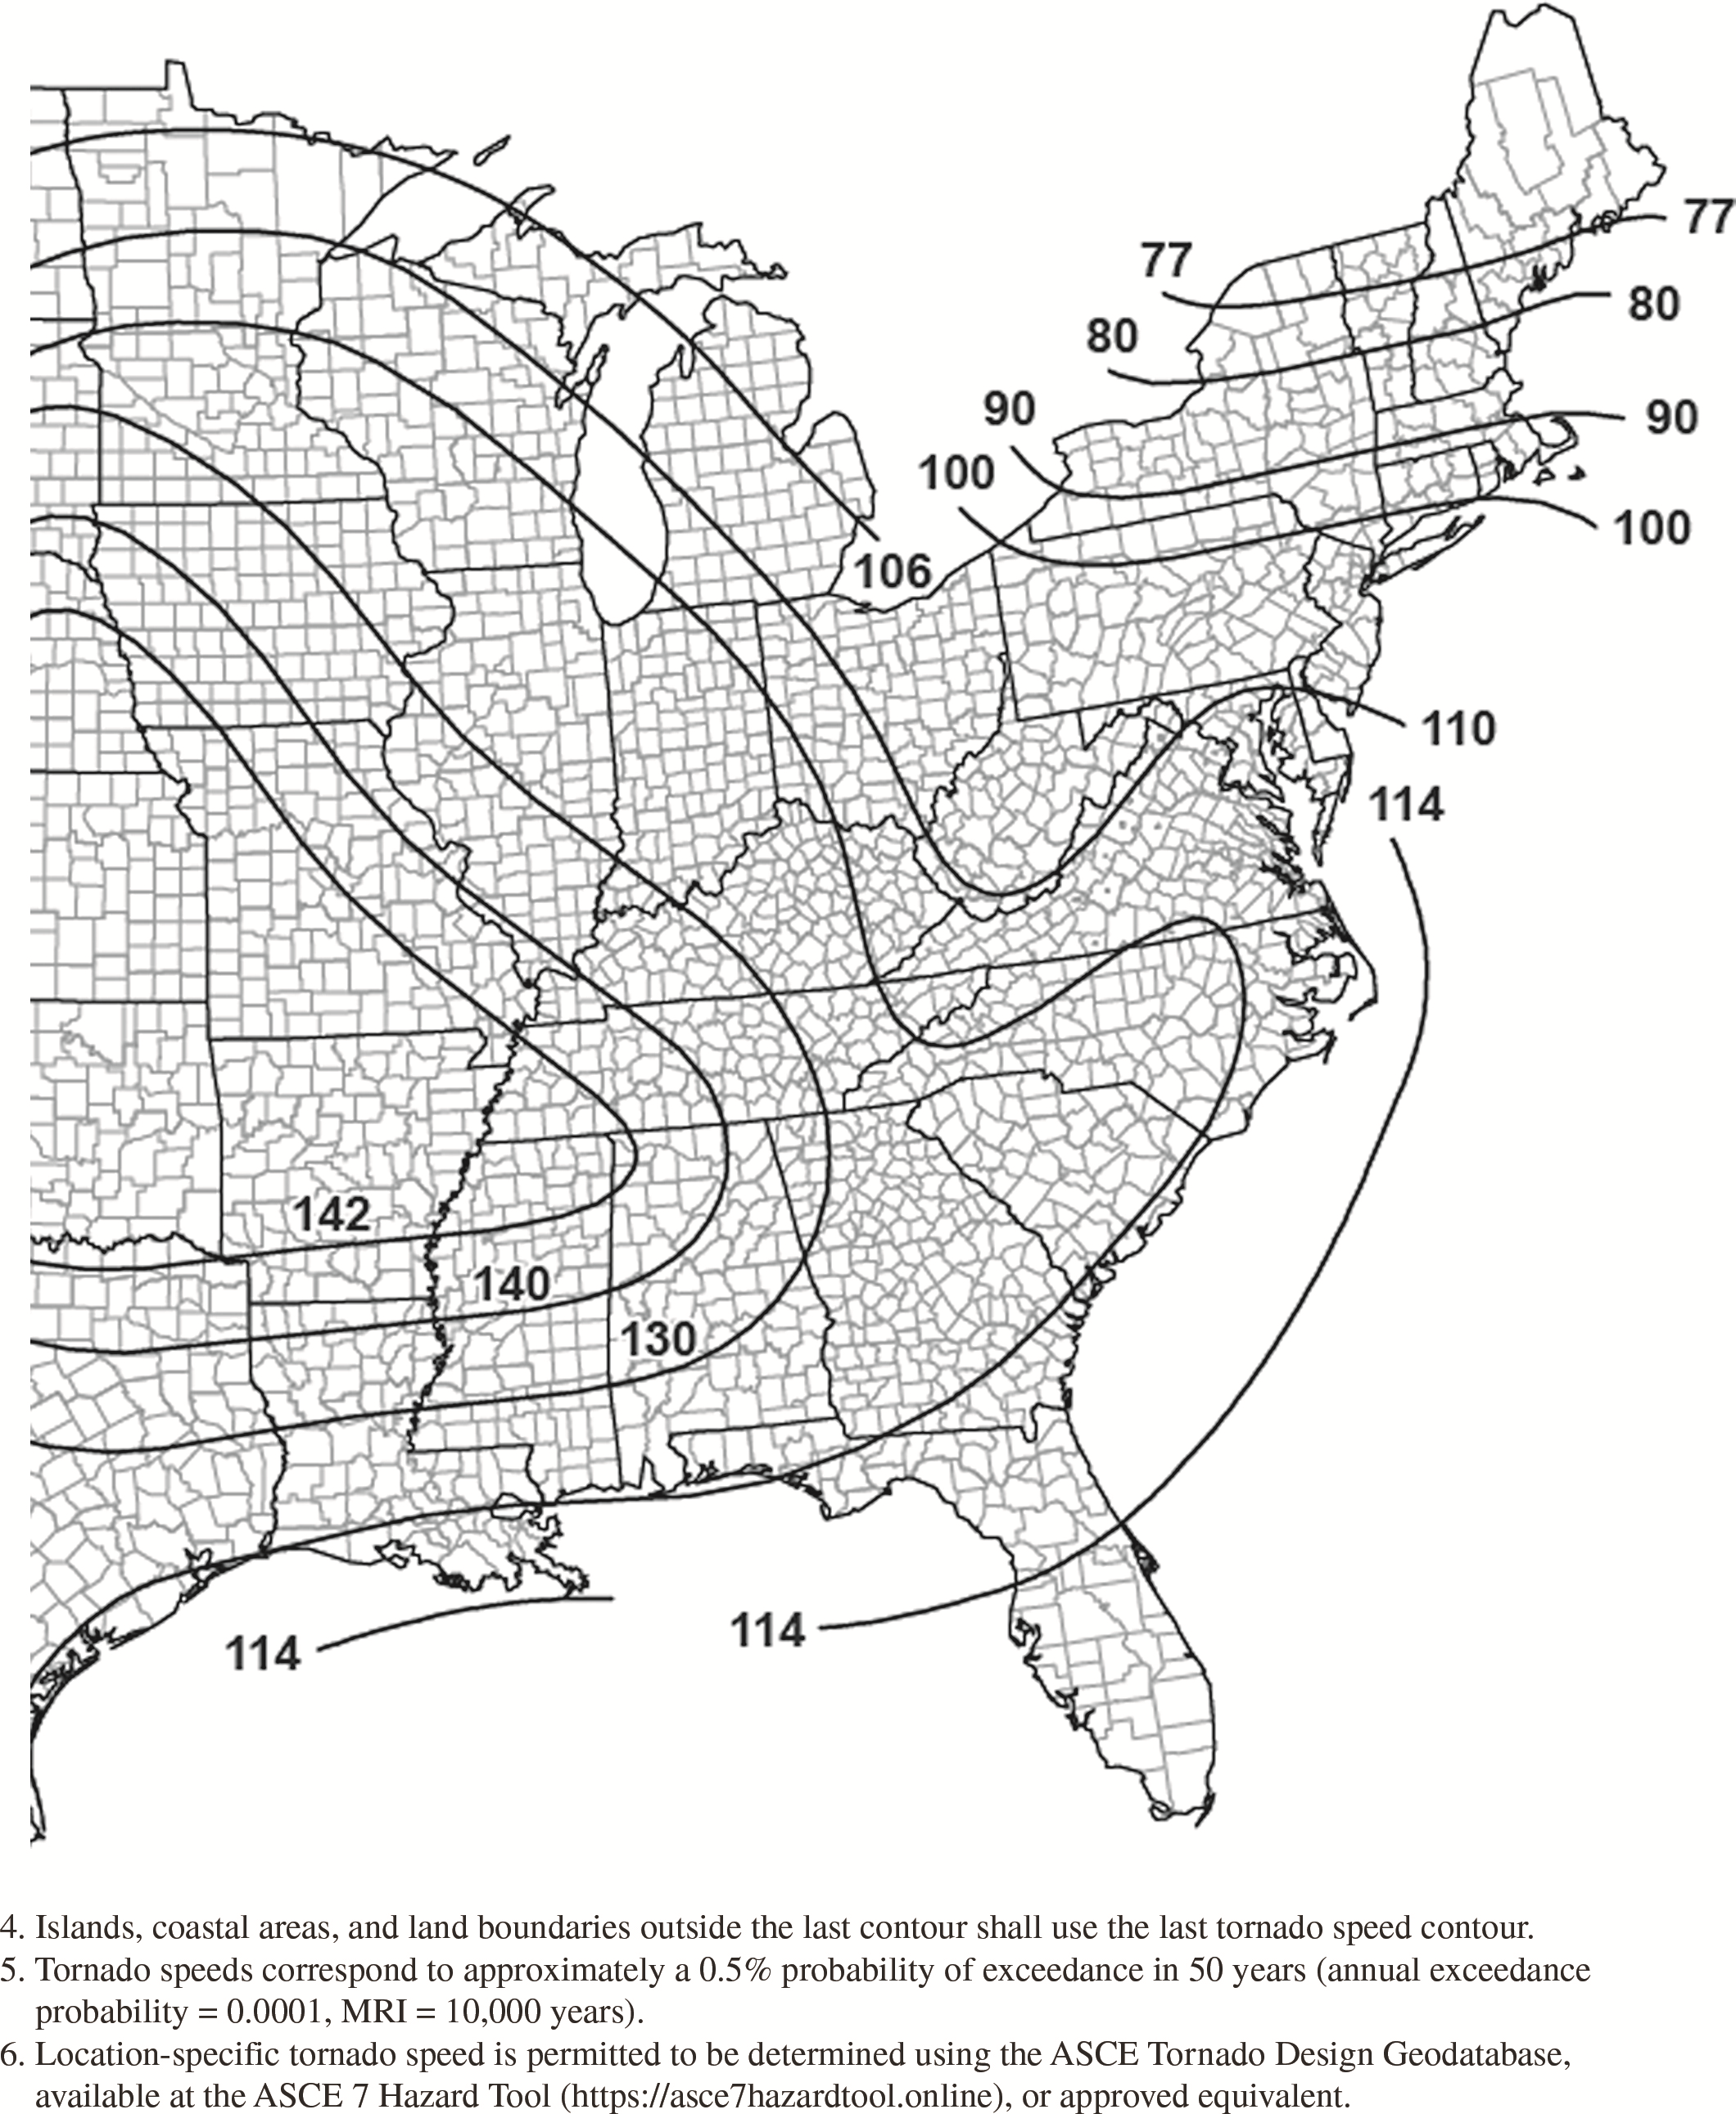
Figure G.2-1G. Tornado speeds for 10,000-year MRI for effective
plan area of 1,000,000 ft2
(92,903
m2).
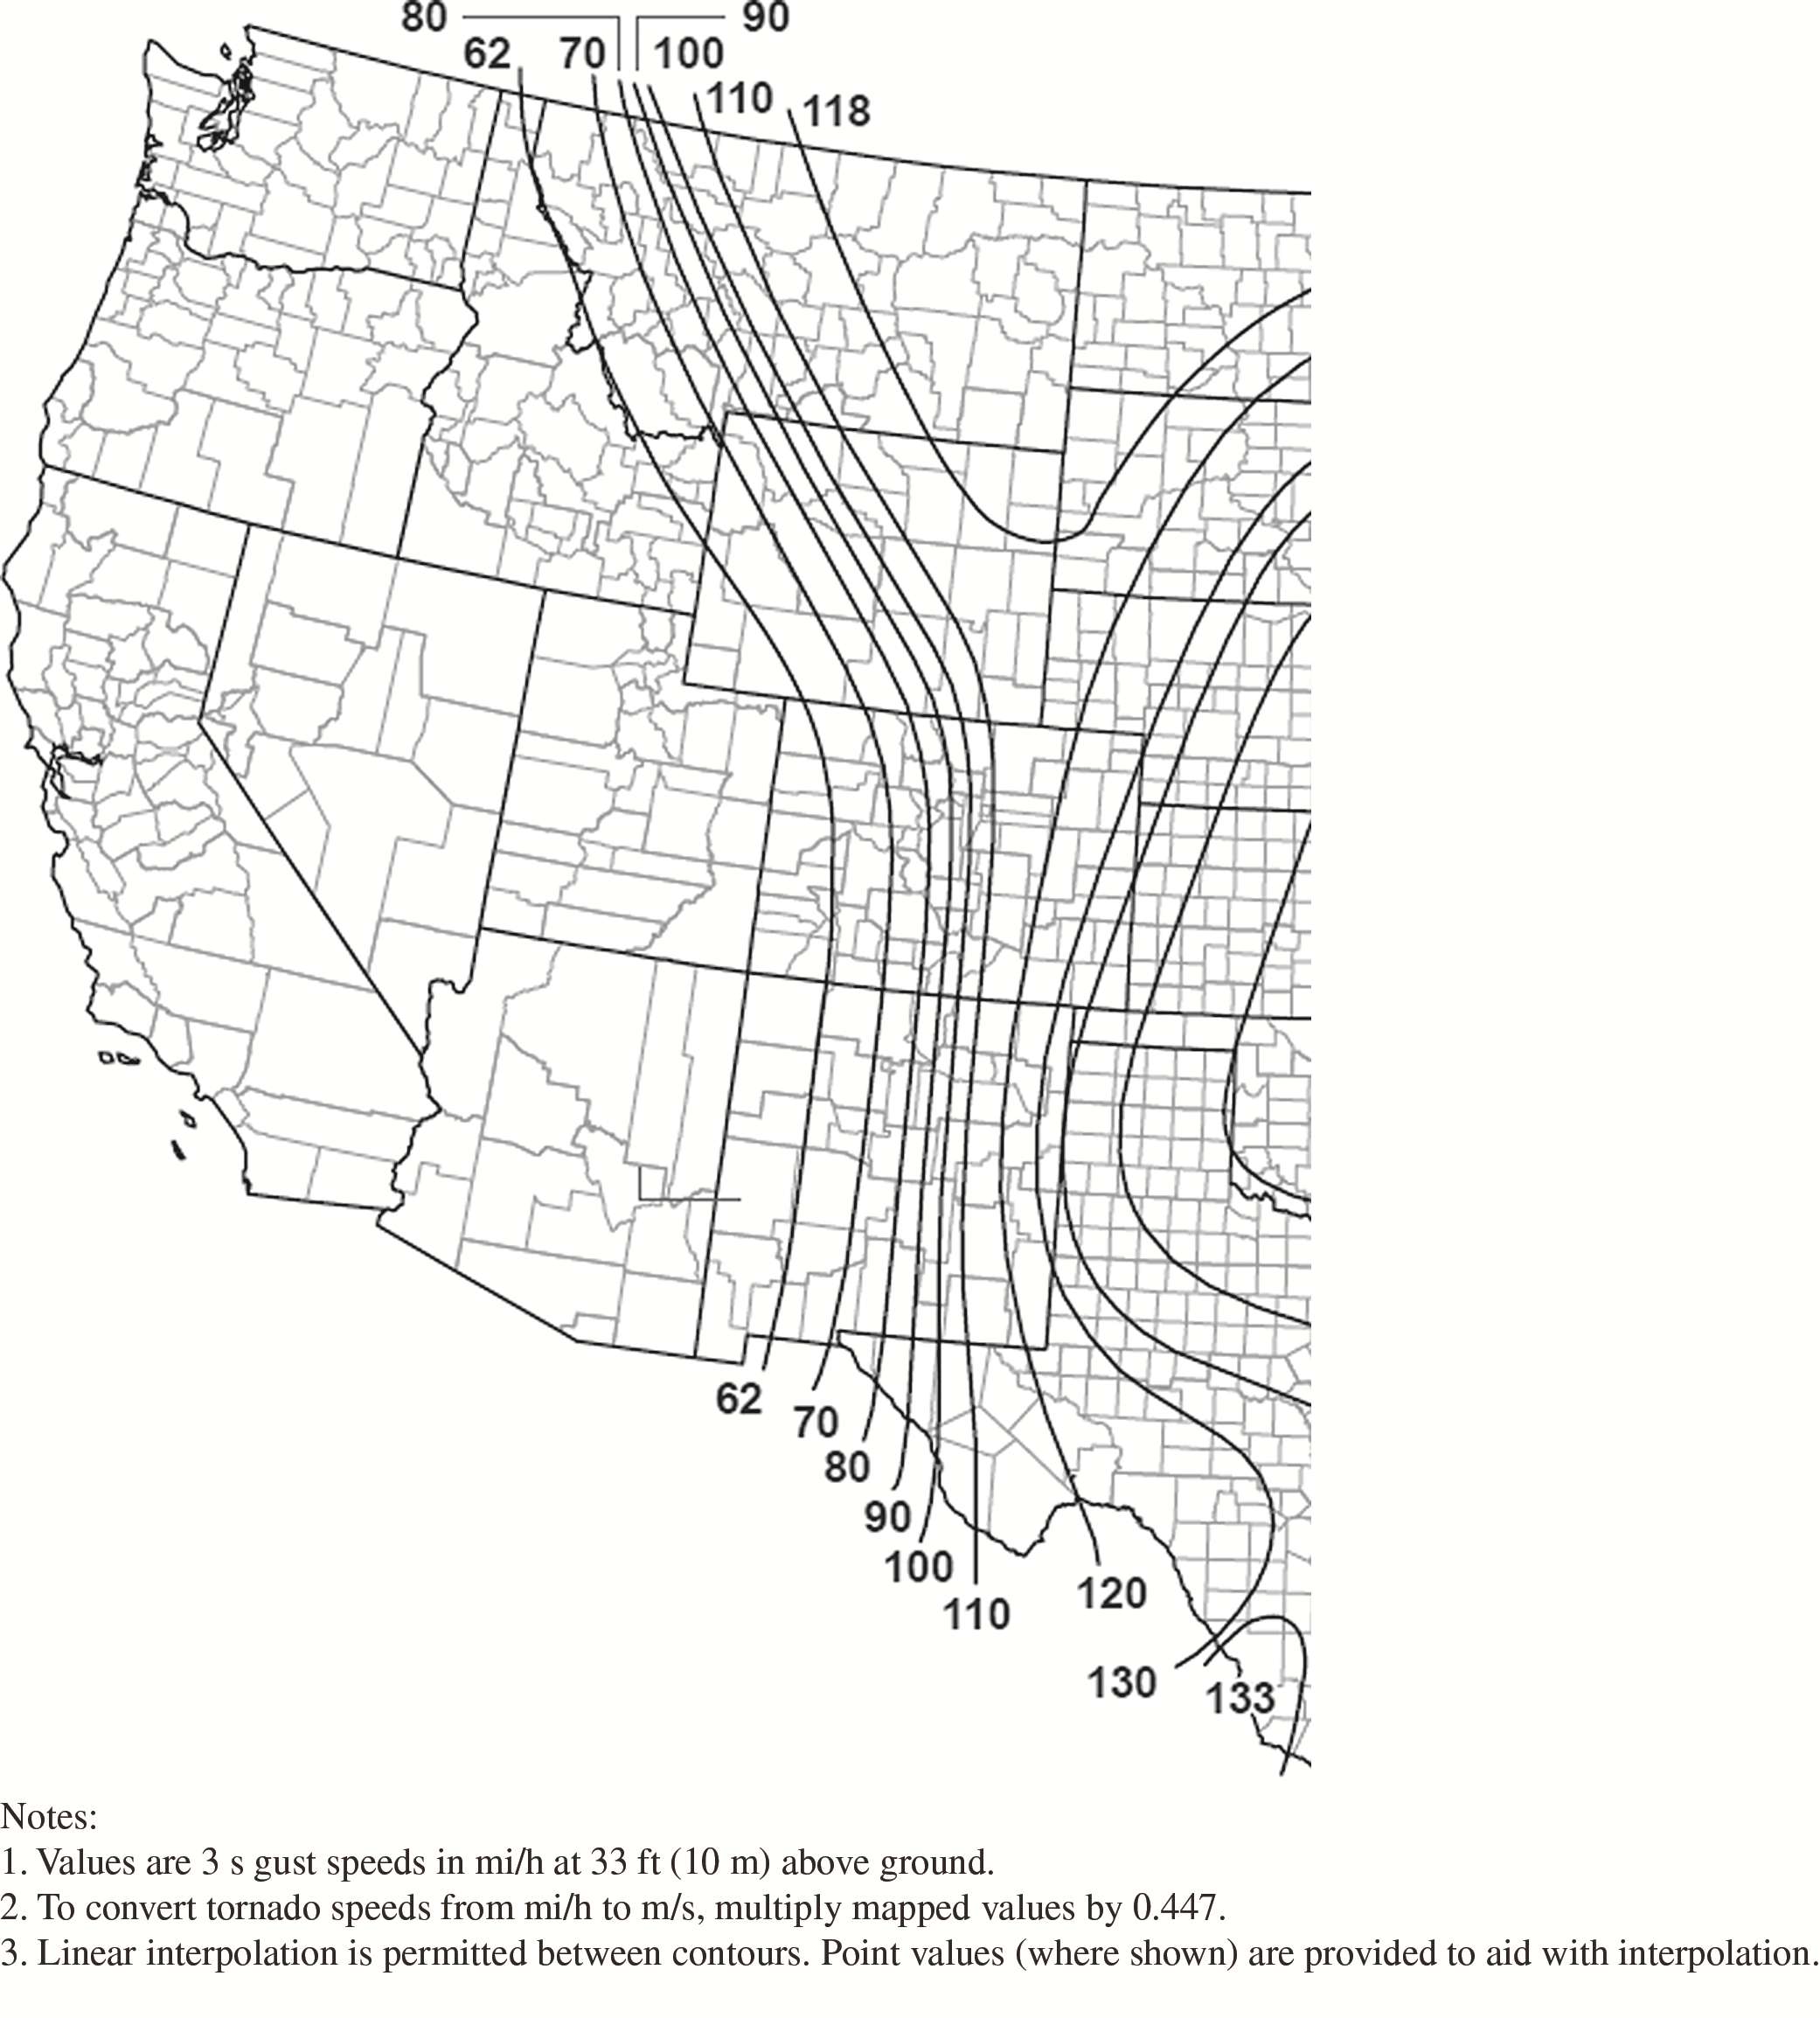
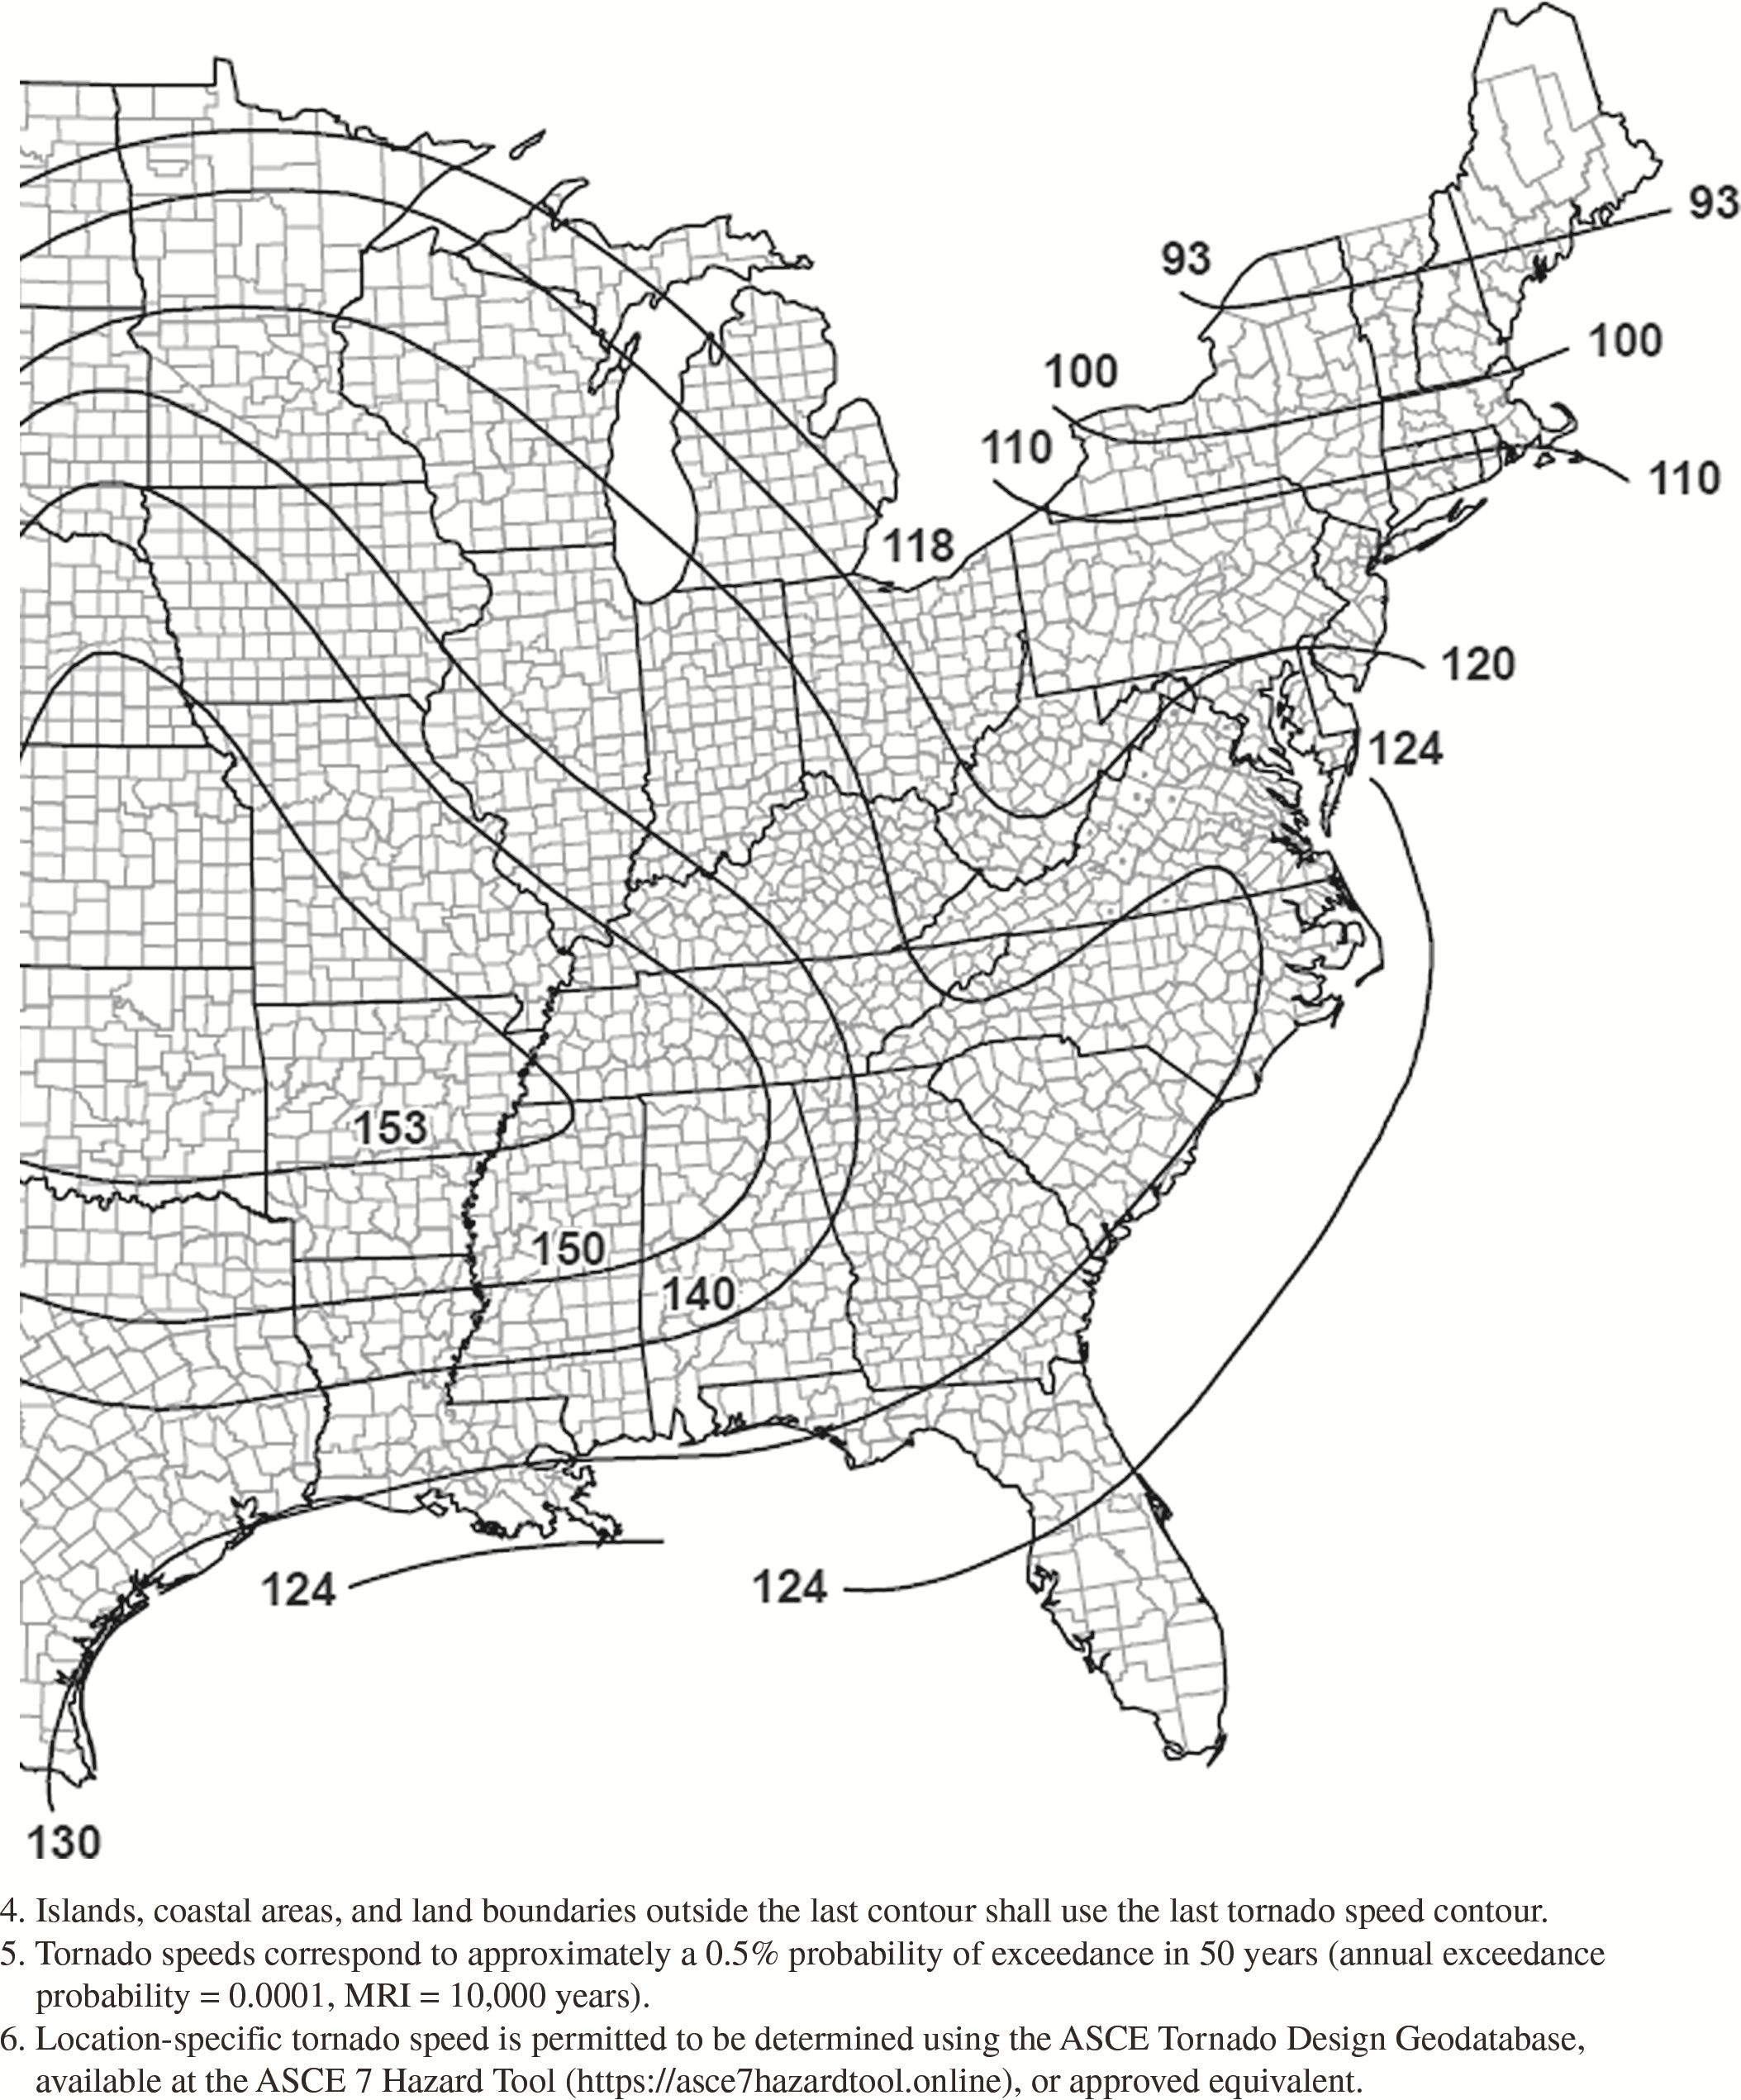
Figure G.2-1H. Tornado speeds for 10,000-year MRI for effective
plan area of 4,000,000 ft2
(371,612
m2).
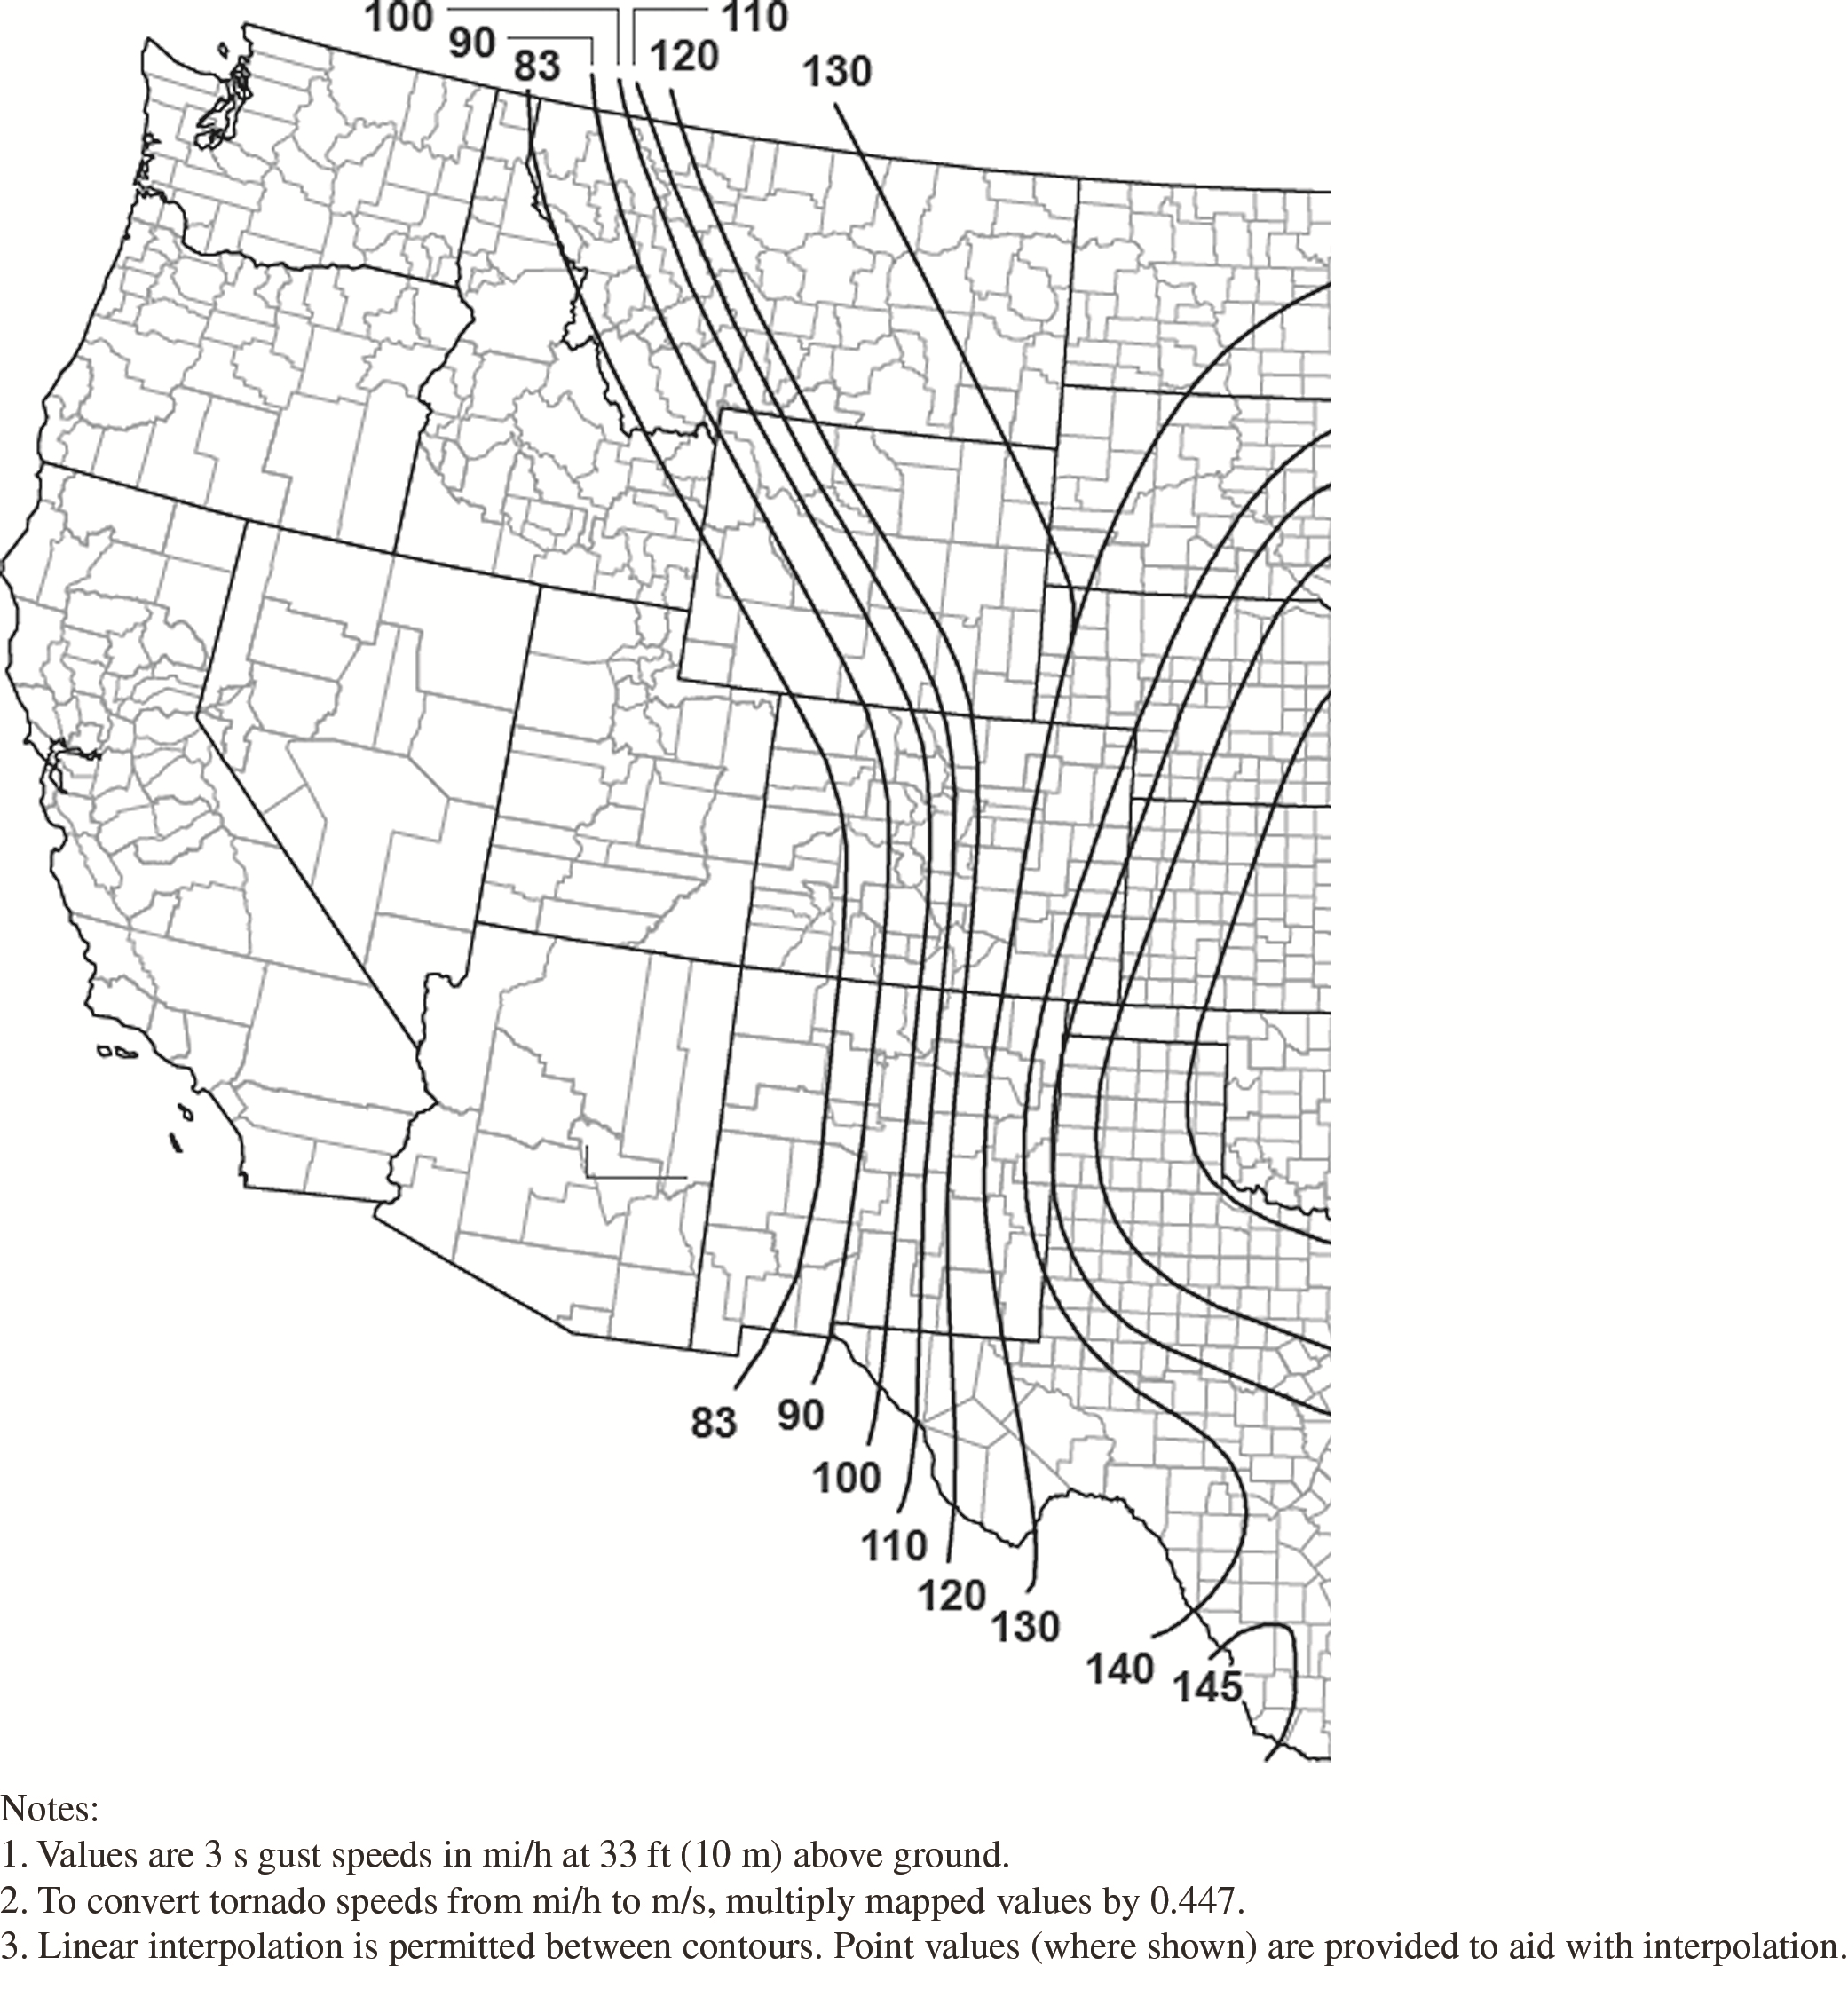
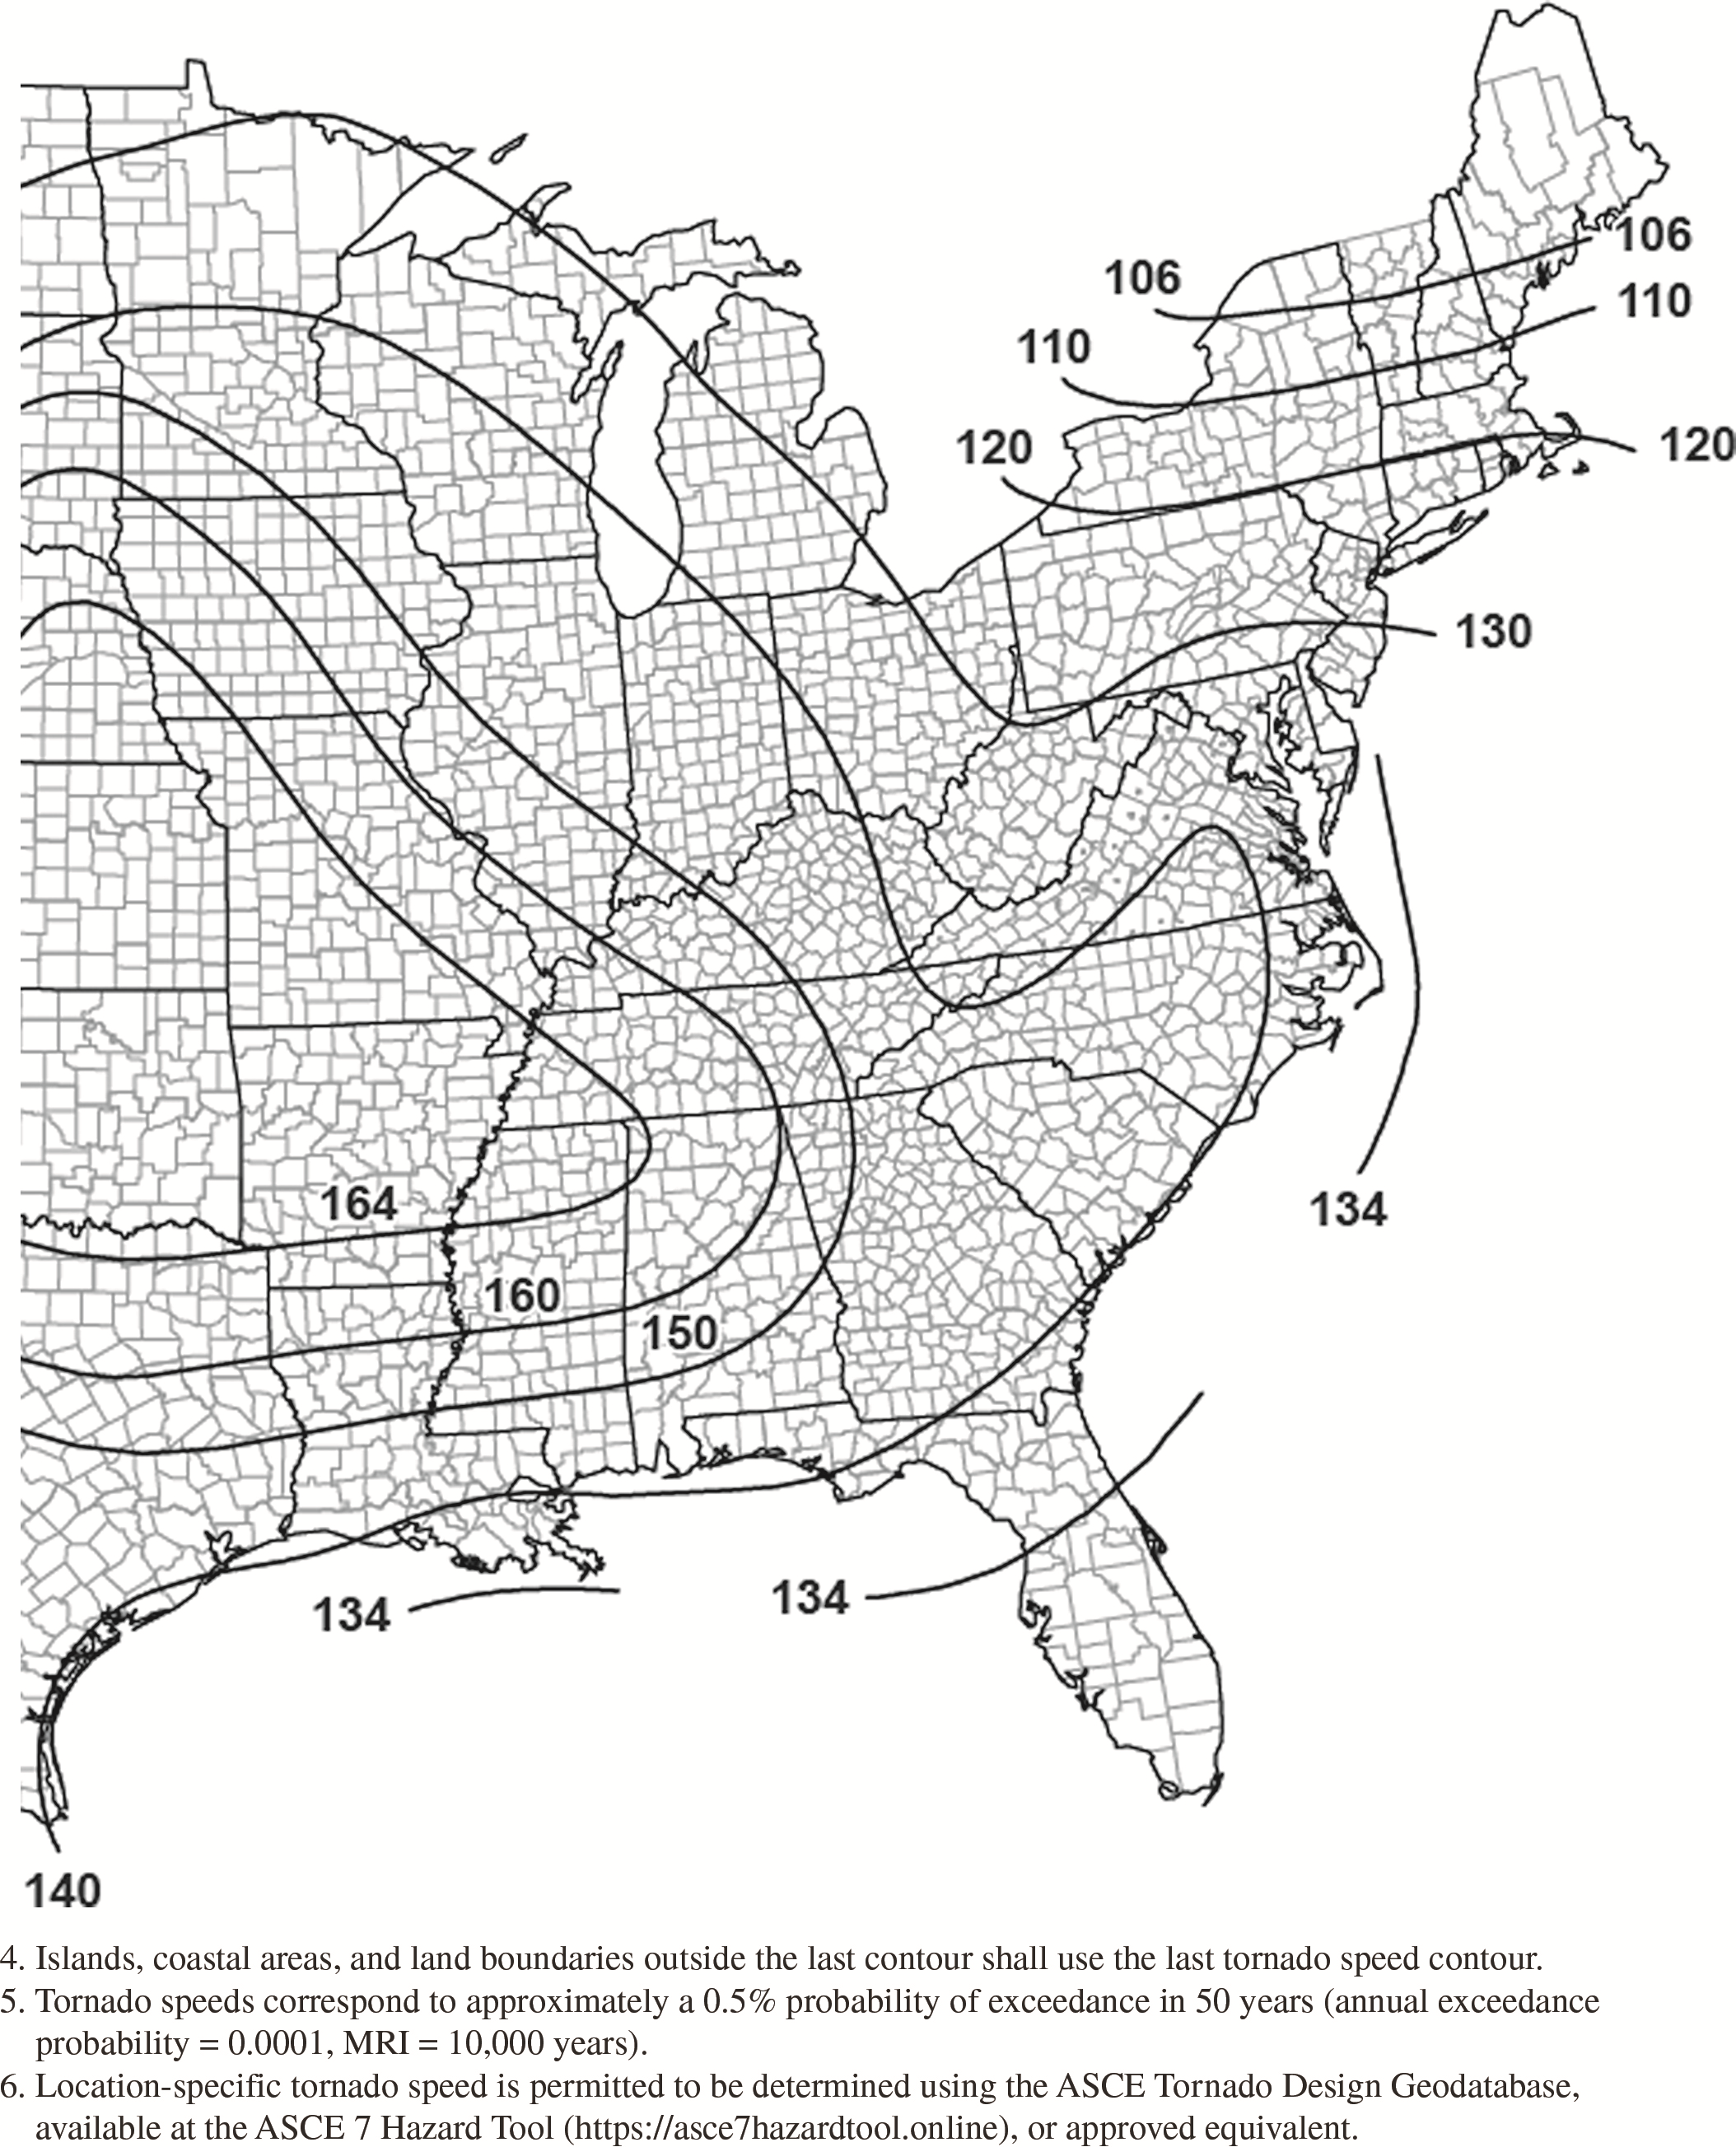
Figure G.2-2A. Tornado speeds for 100,000-year MRI for effective
plan area of 1 ft2
(0.1 m2).
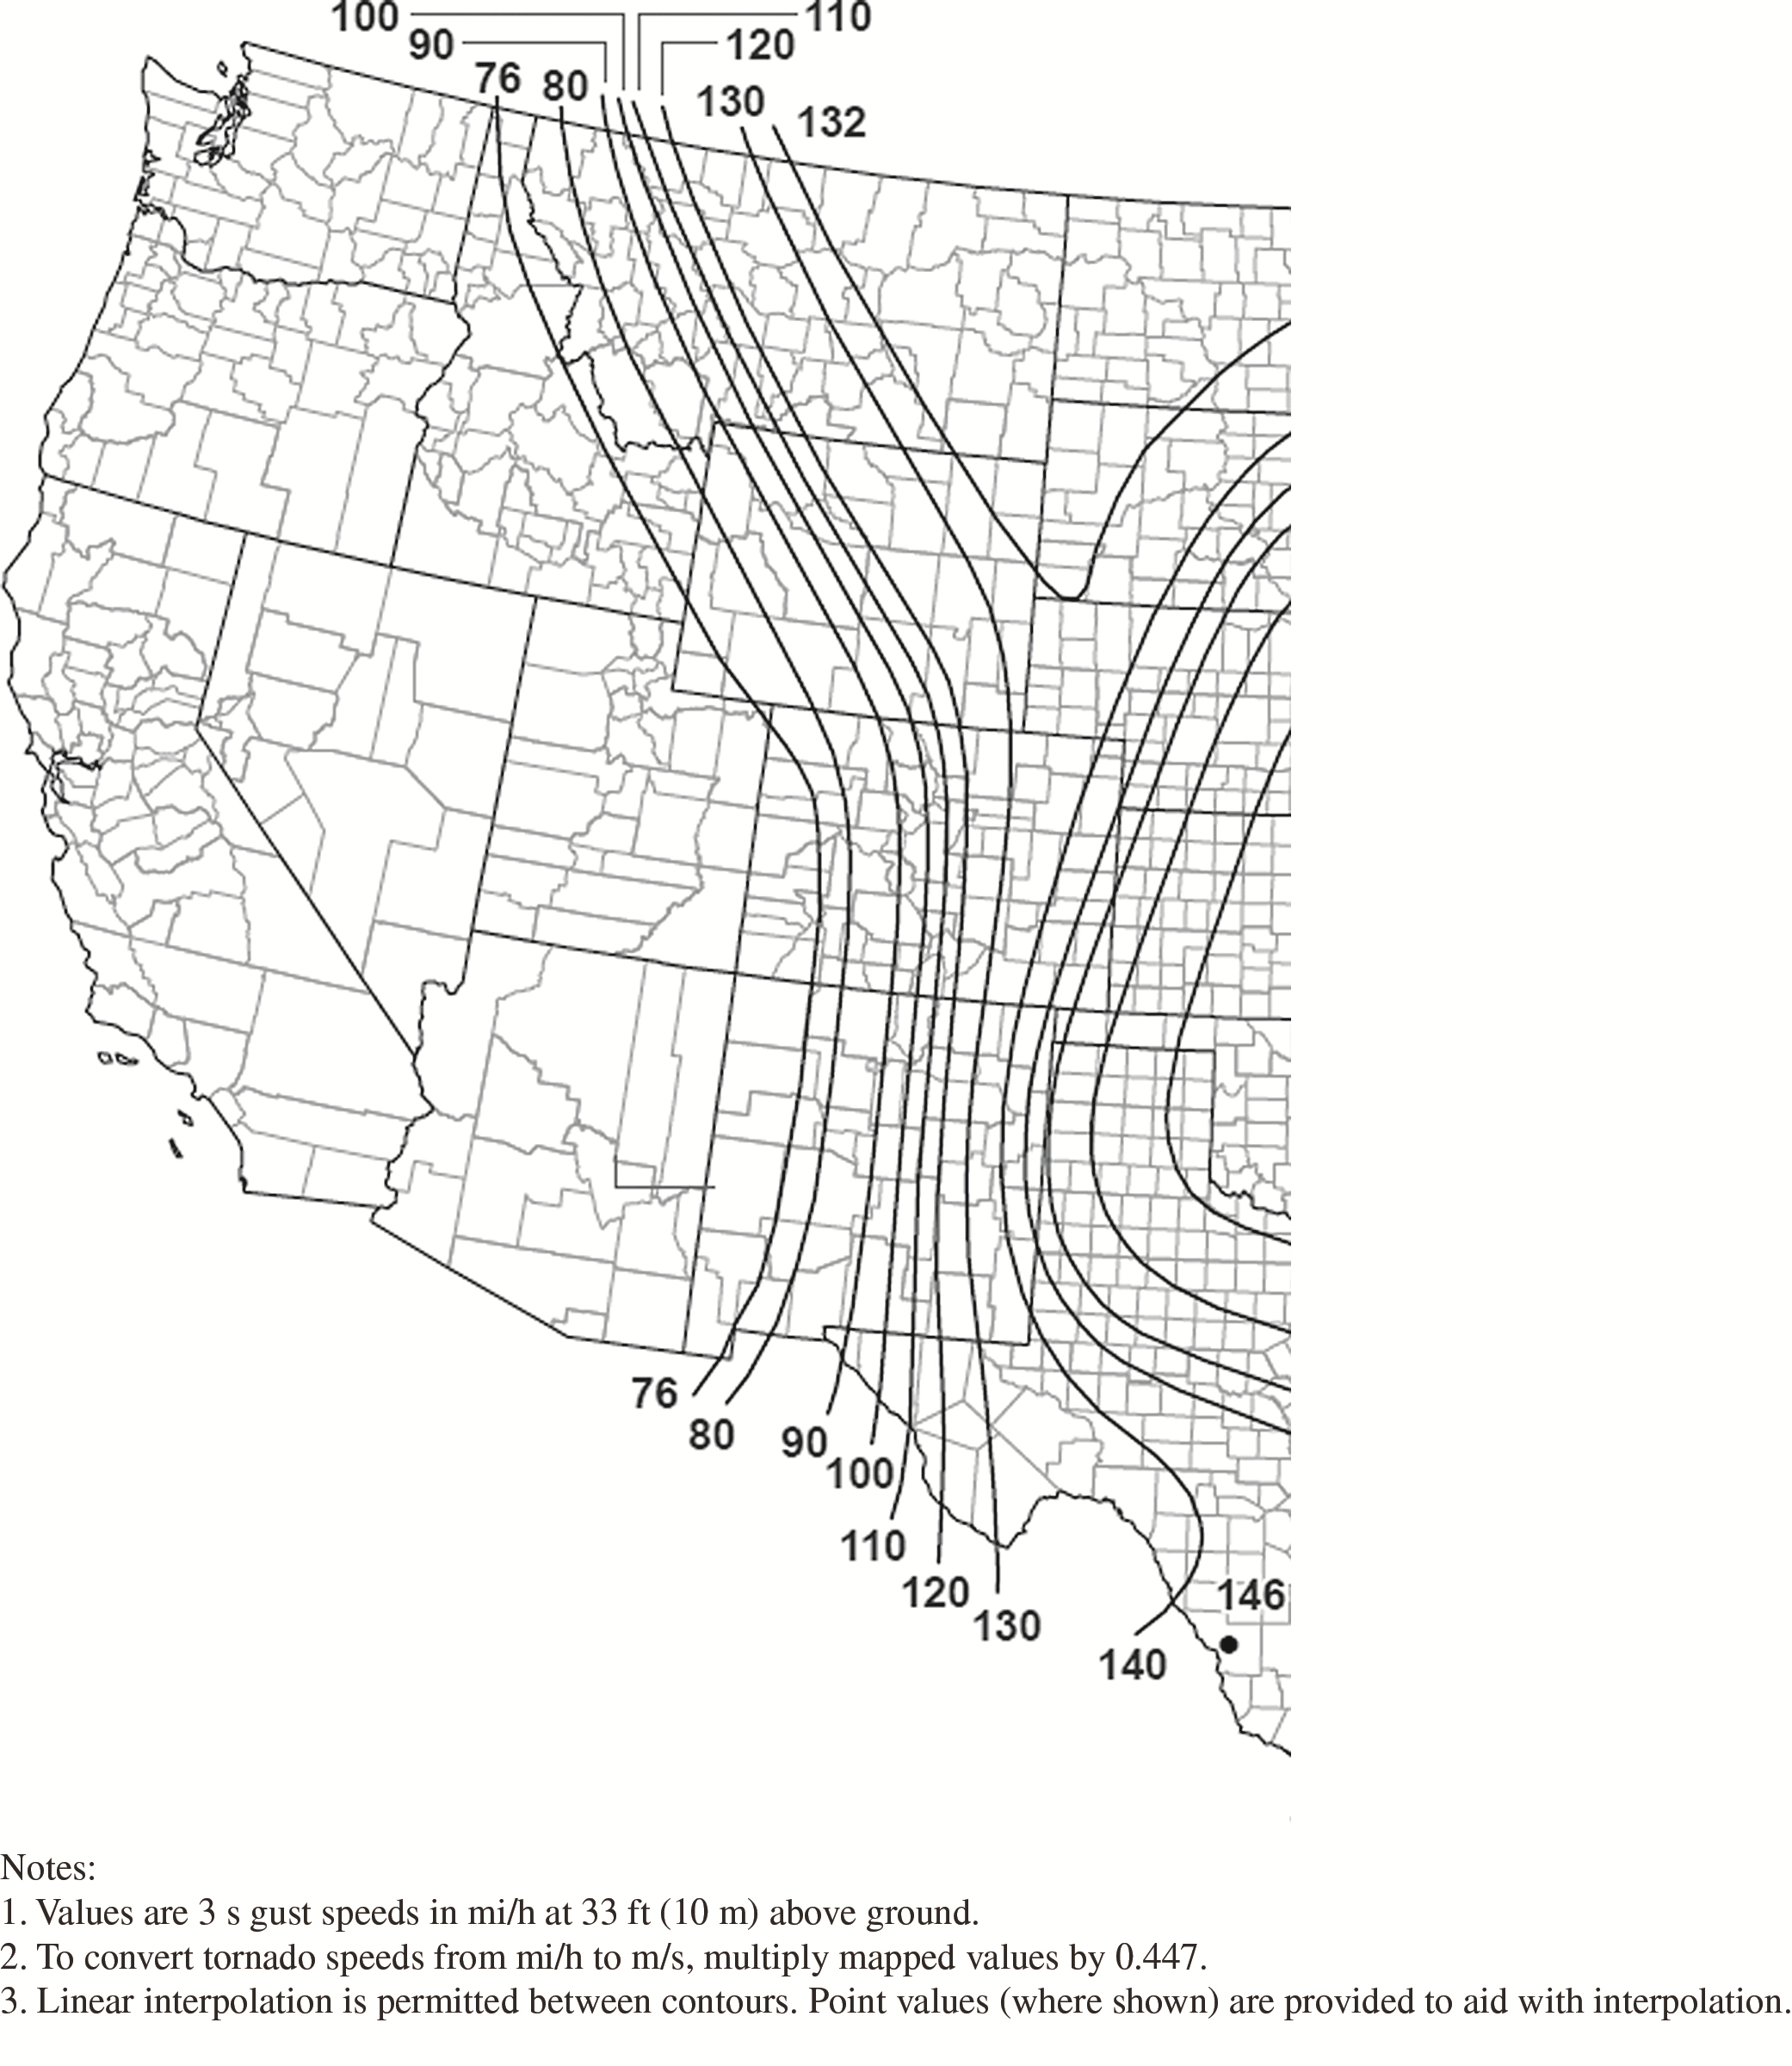
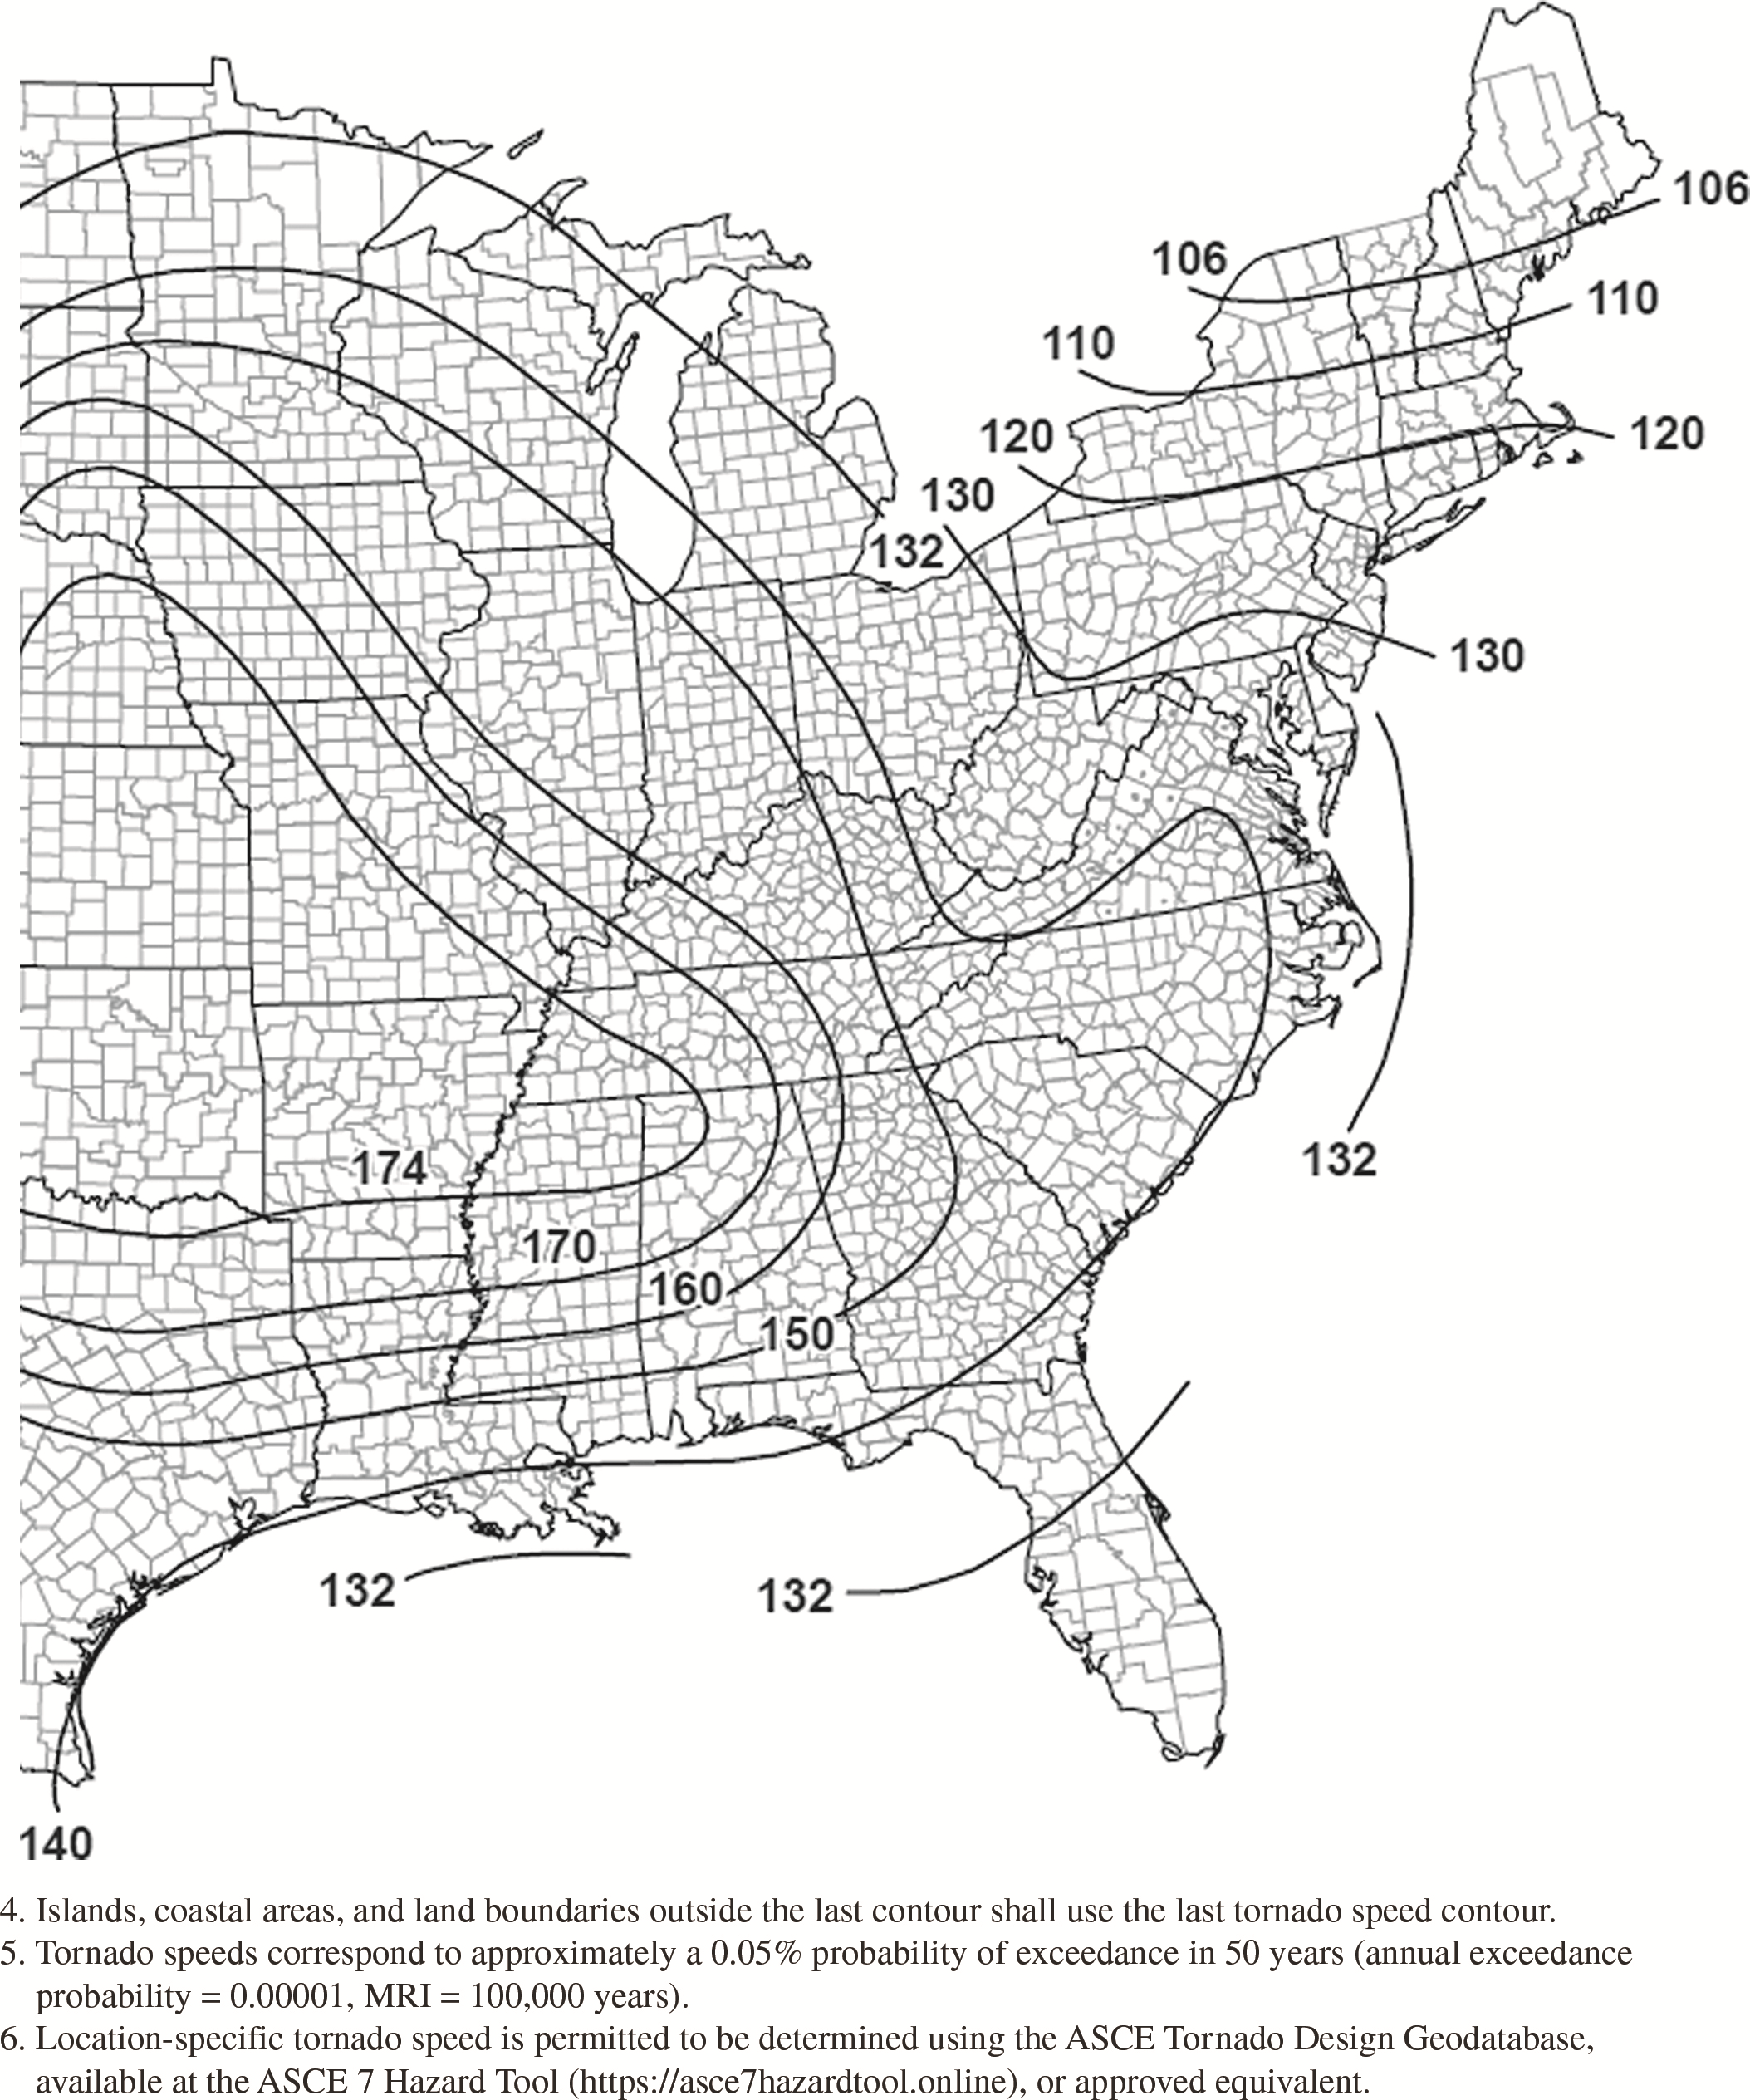
Figure G.2-2B. Tornado speeds for 100,000-year MRI for effective
plan area of 2,000 ft2
(186 m2).
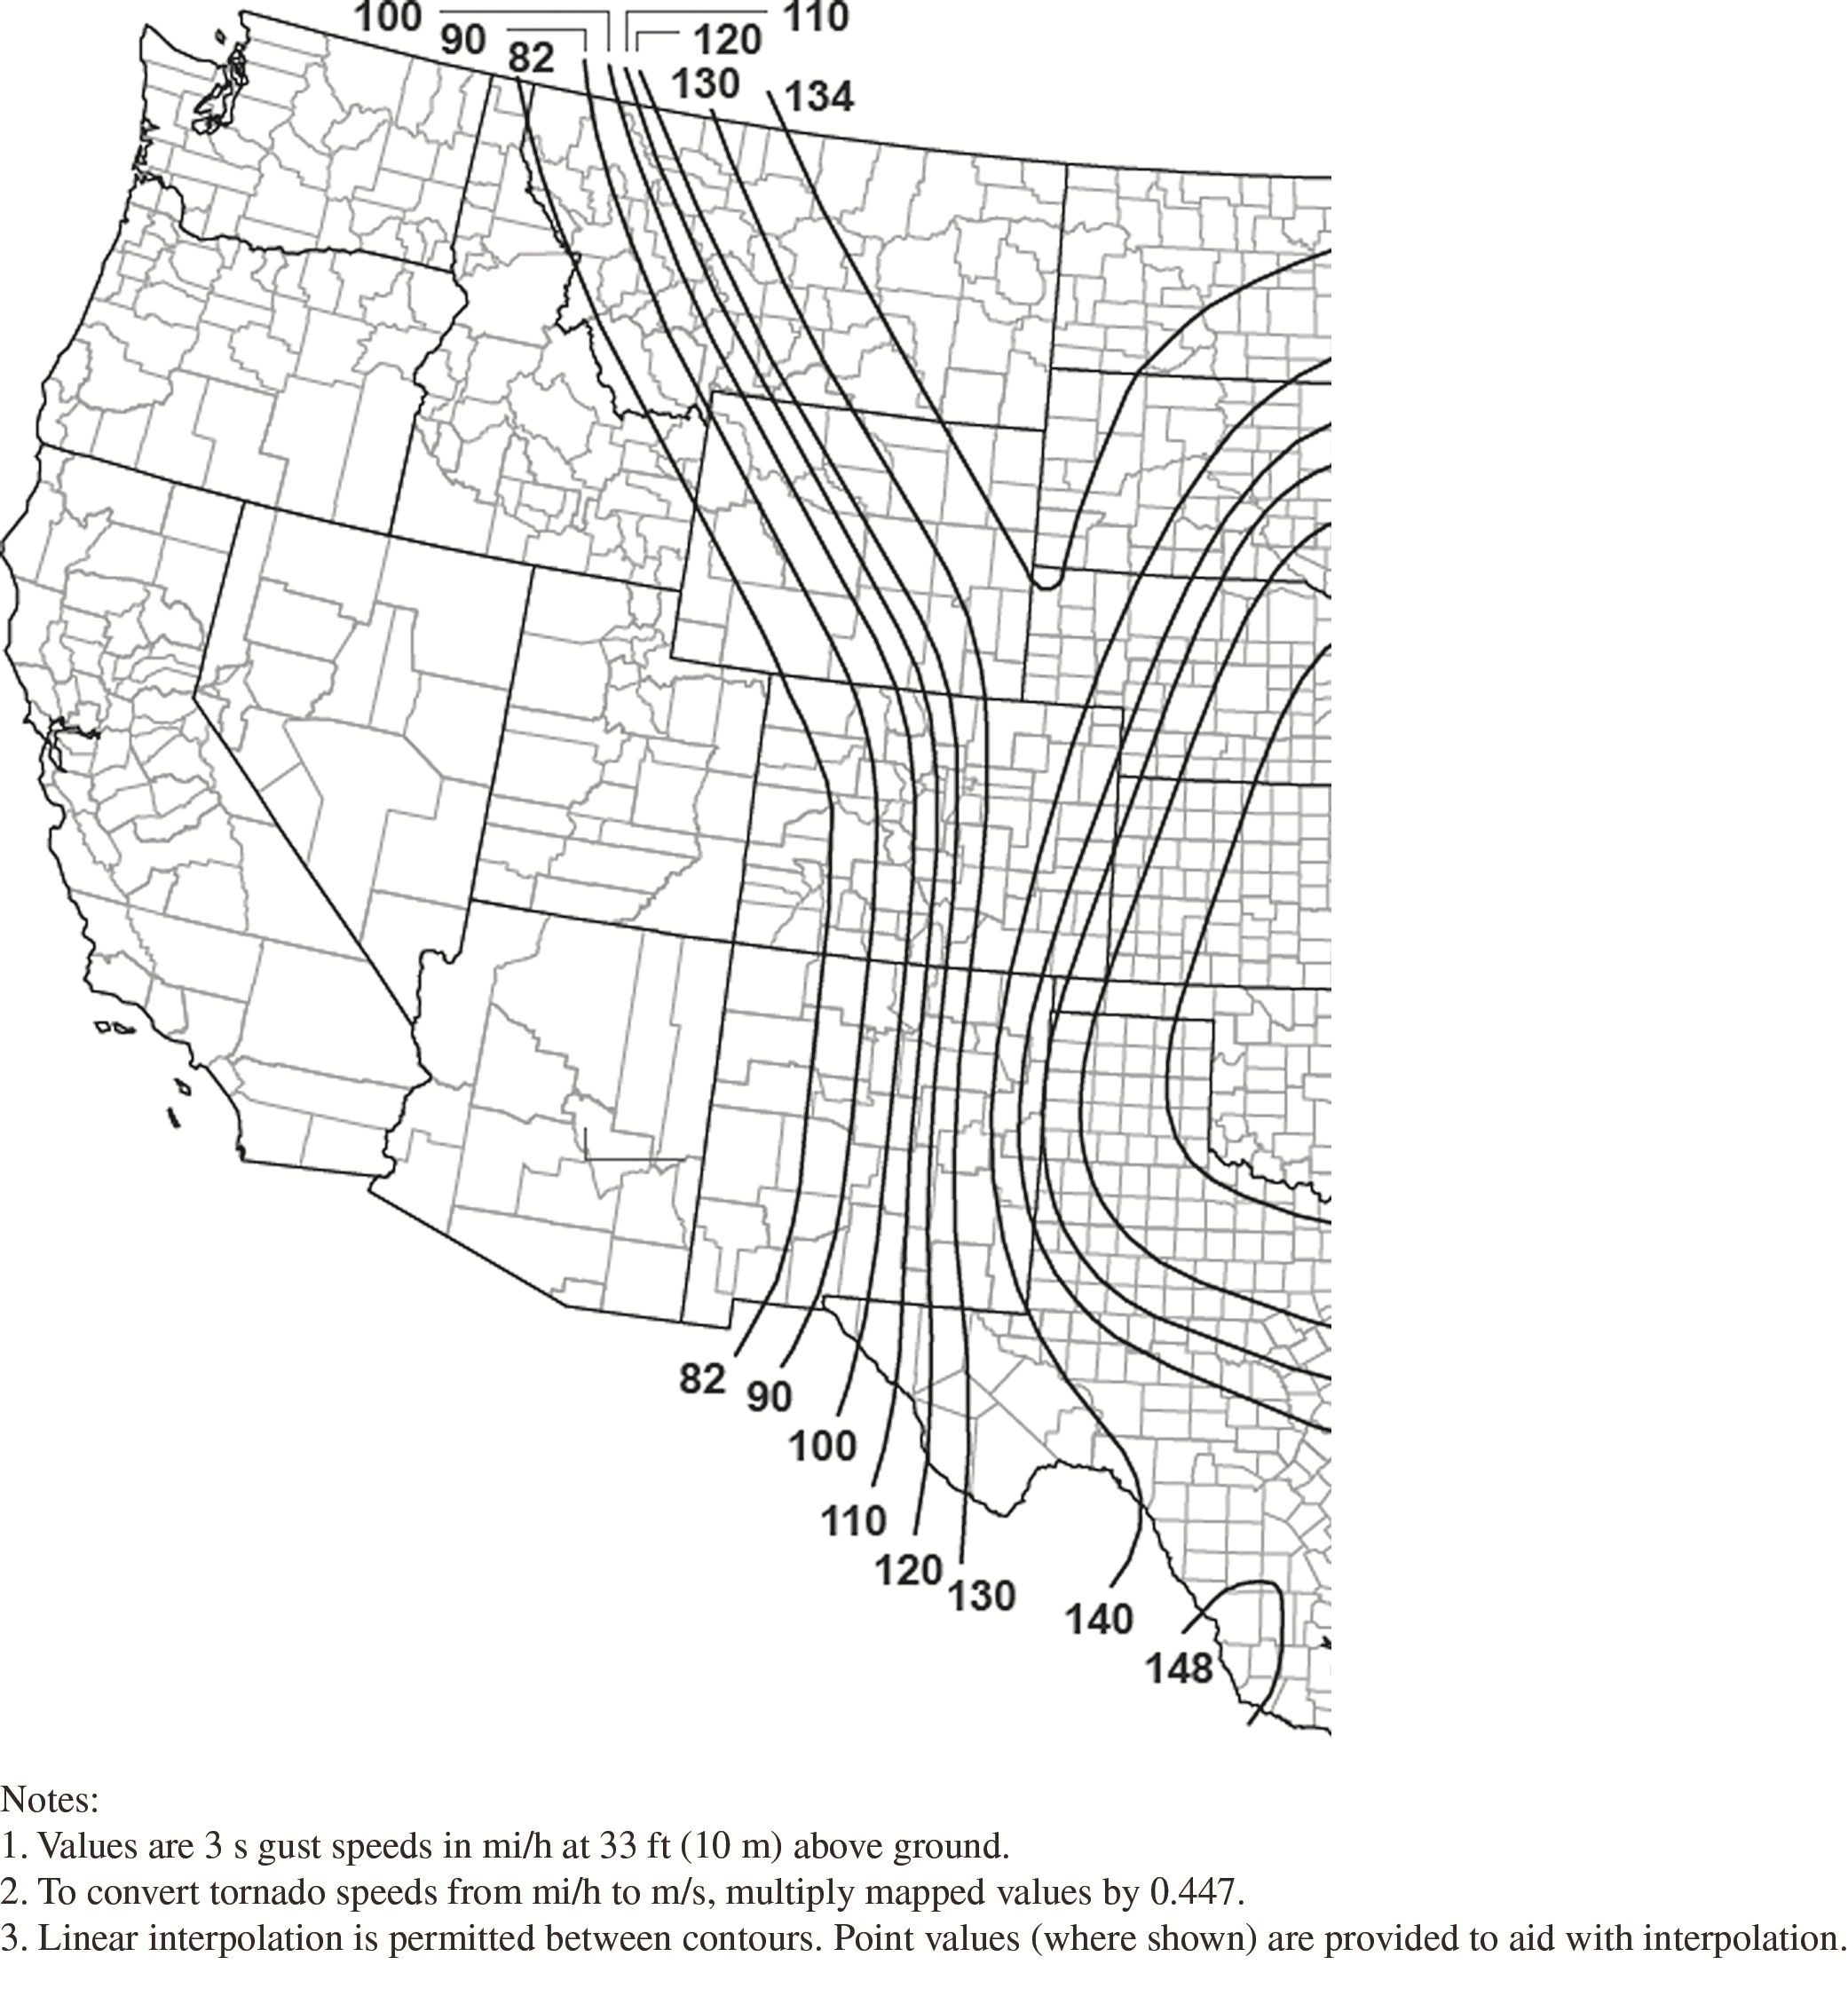
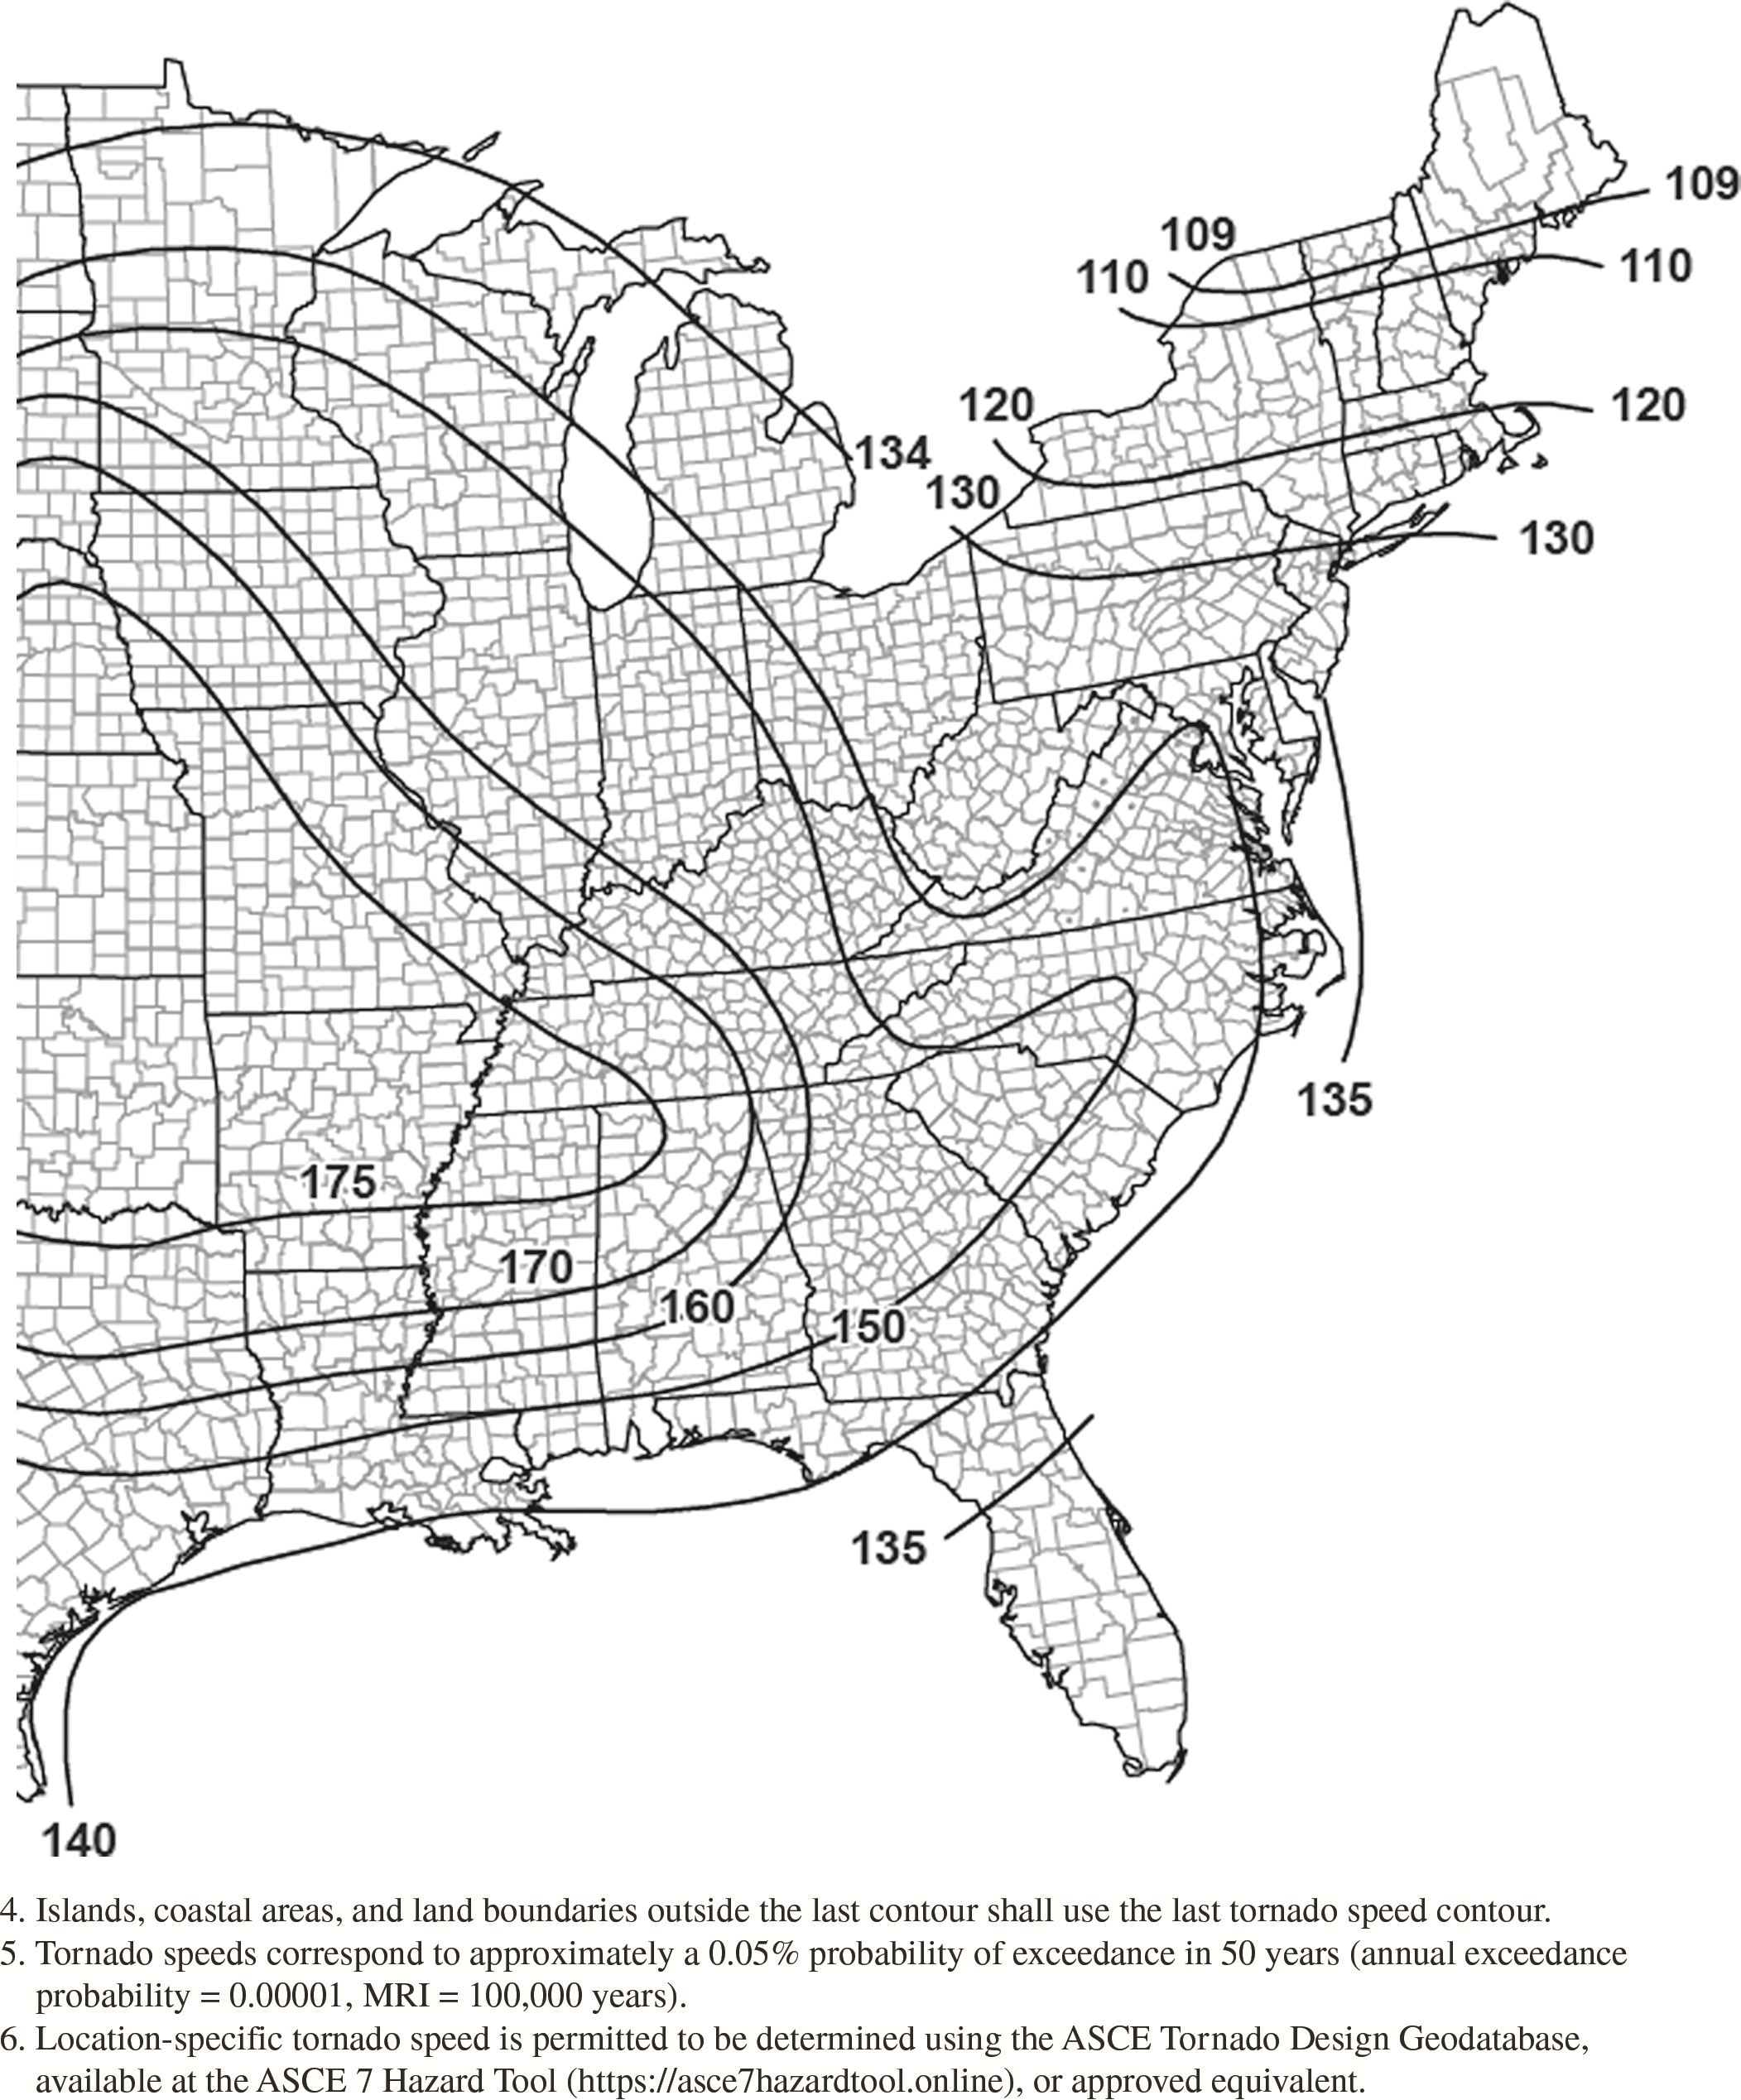
Figure G.2-12C. Tornado speeds for 100,000-year MRI for effective
plan area of 10,000 ft2
(929 m2).
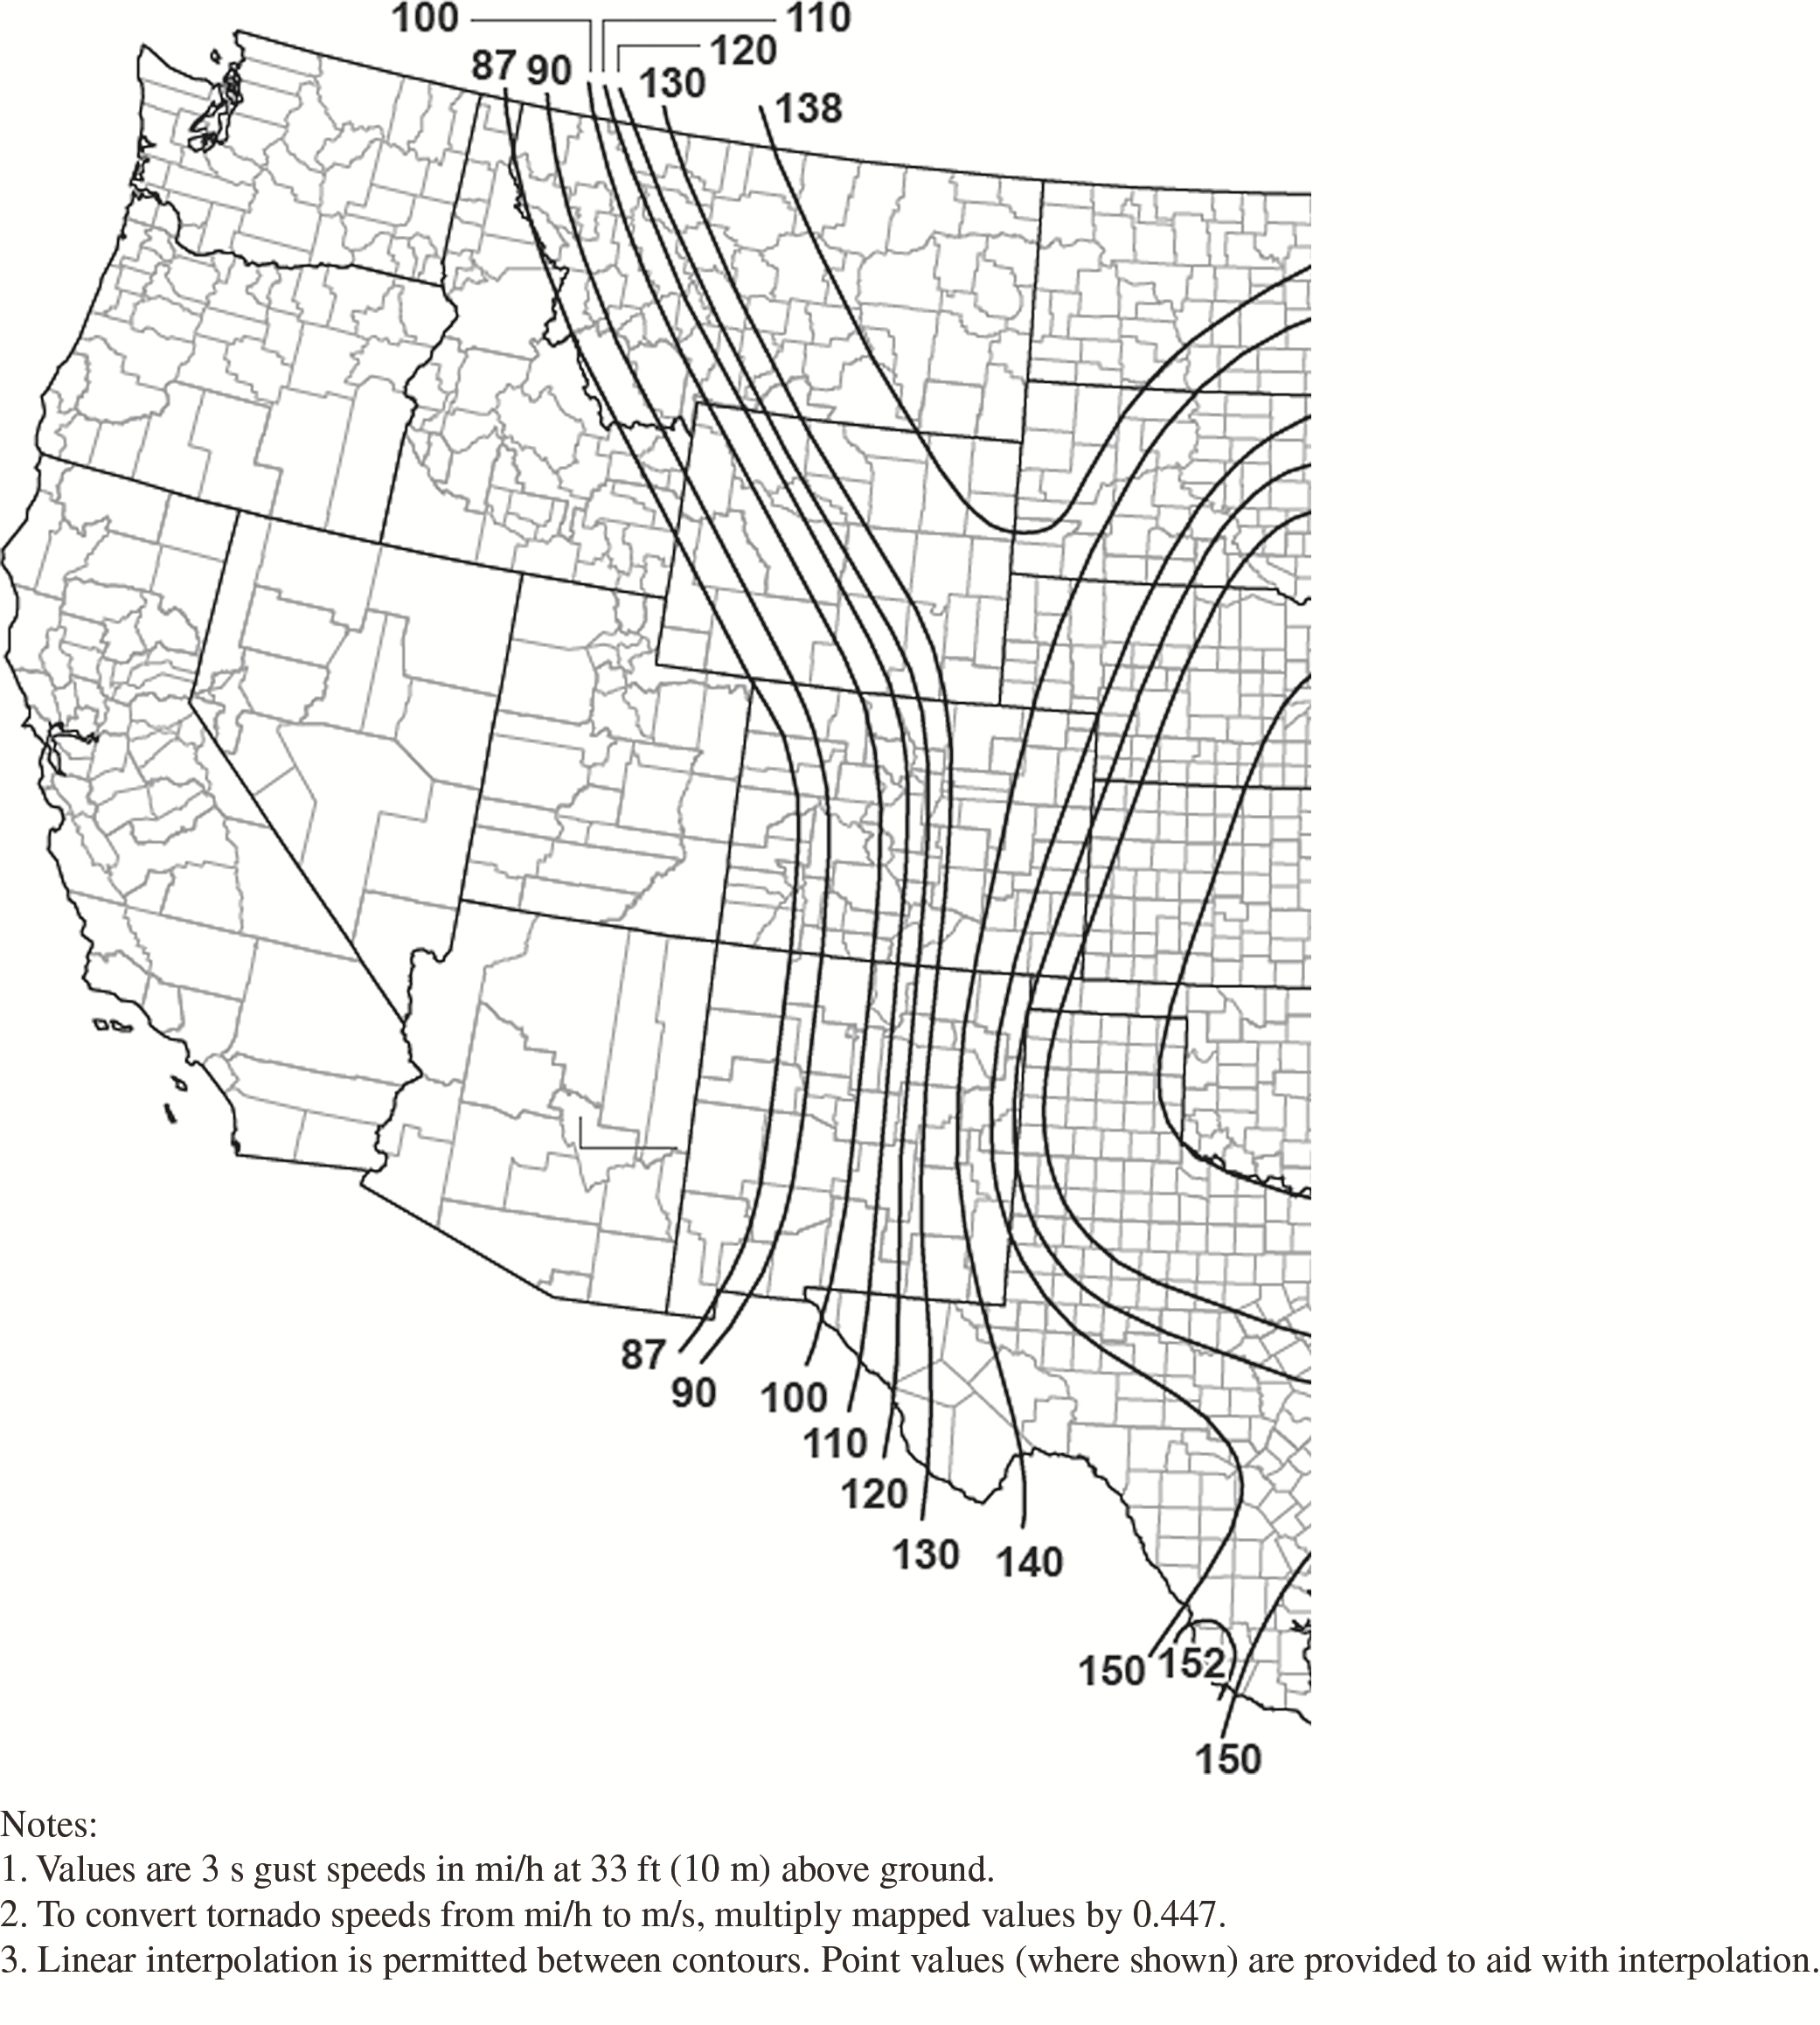
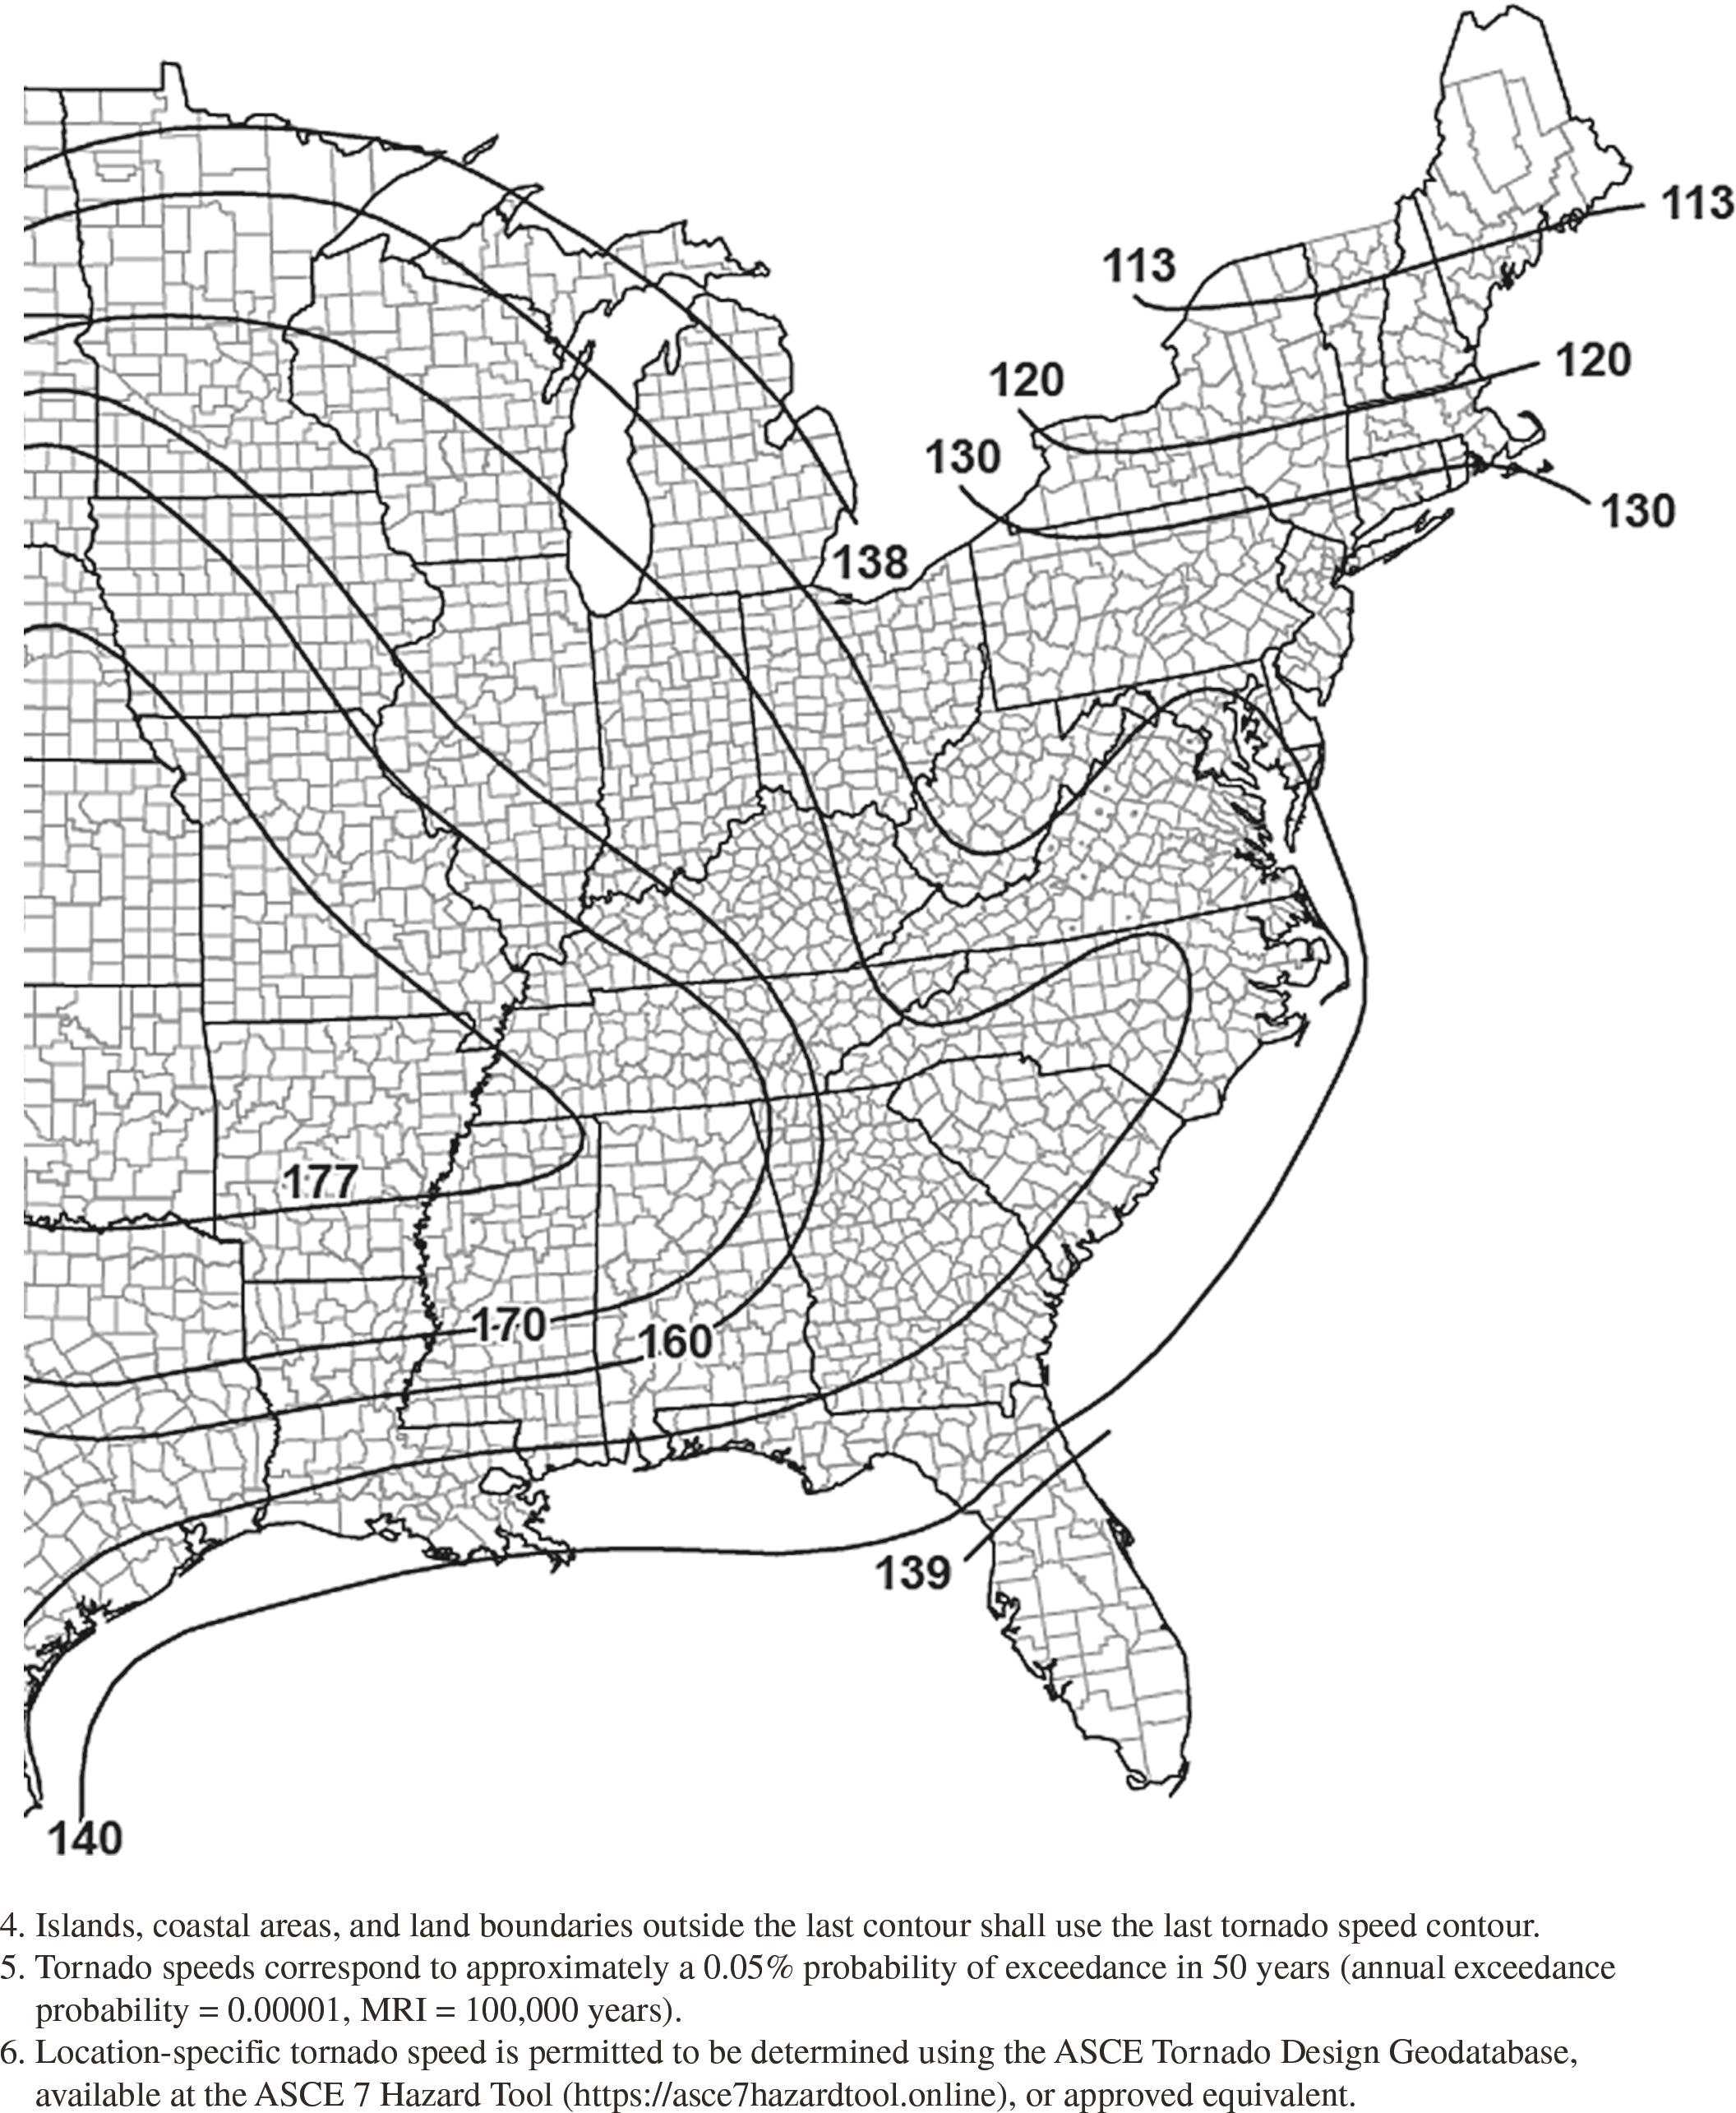
Figure G.2-2D. Tornado speeds for 100,000-year MRI for effective
plan area of 40,000 ft2
(3,716 m2).
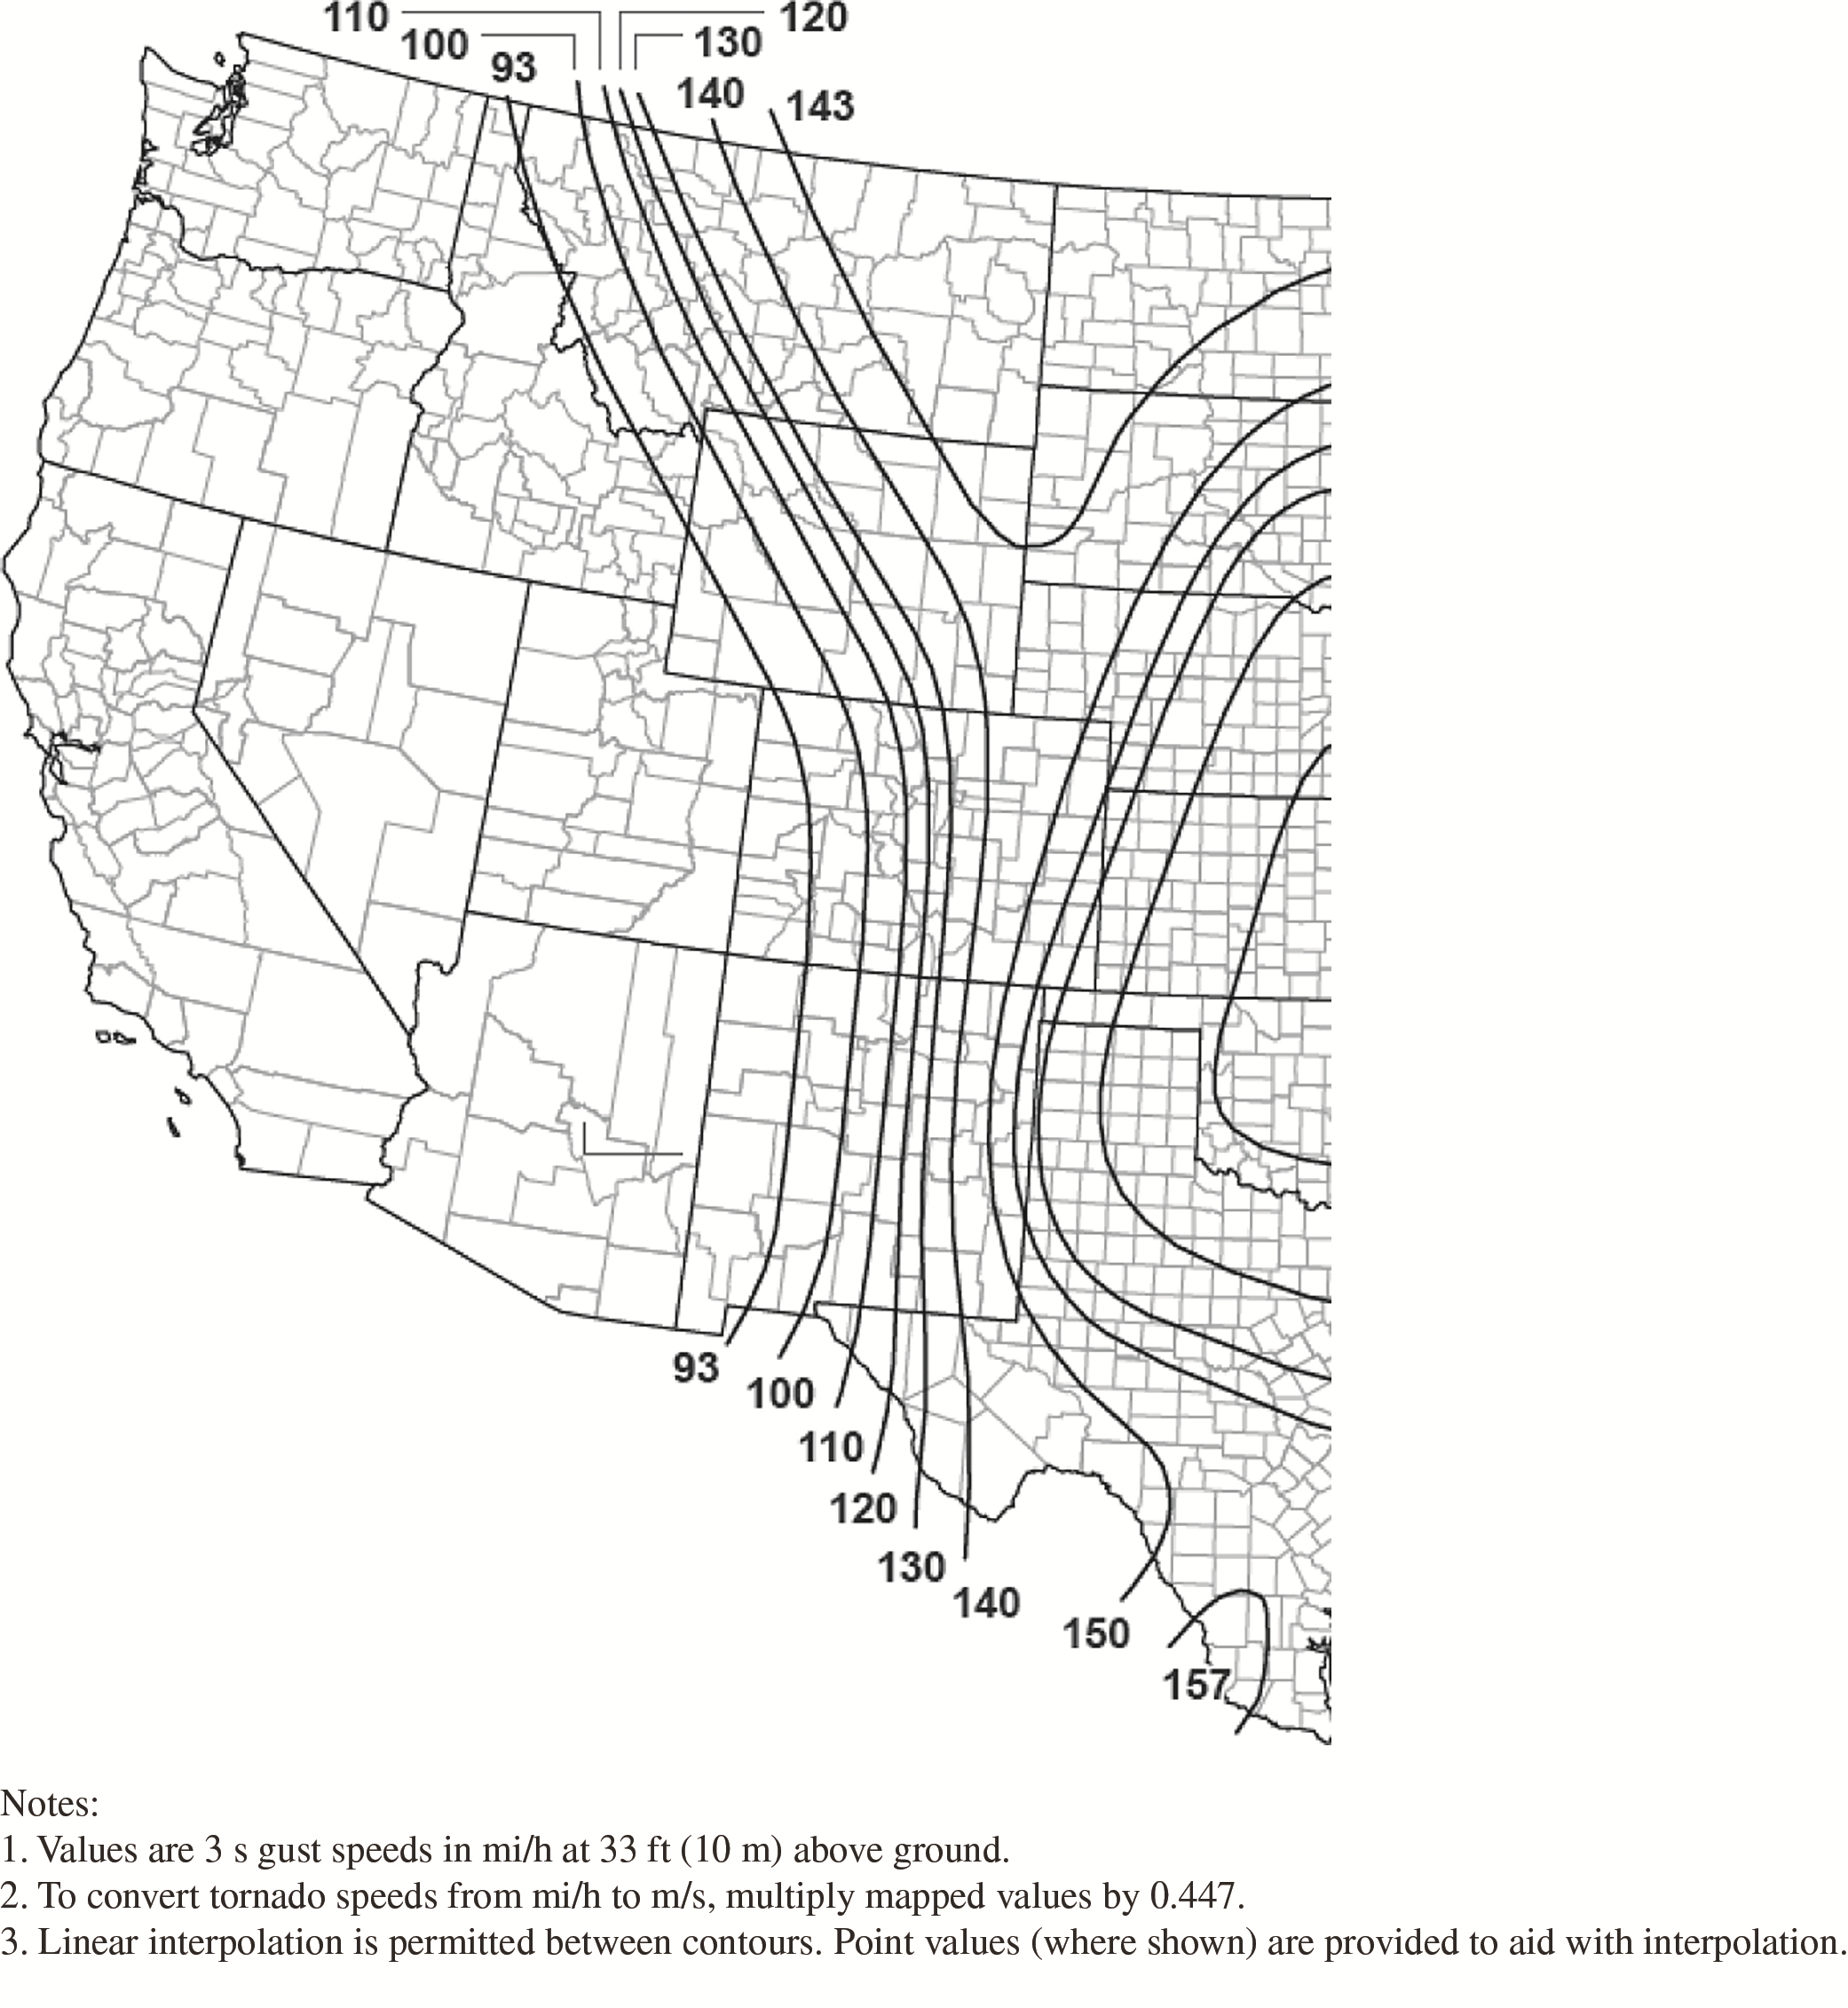
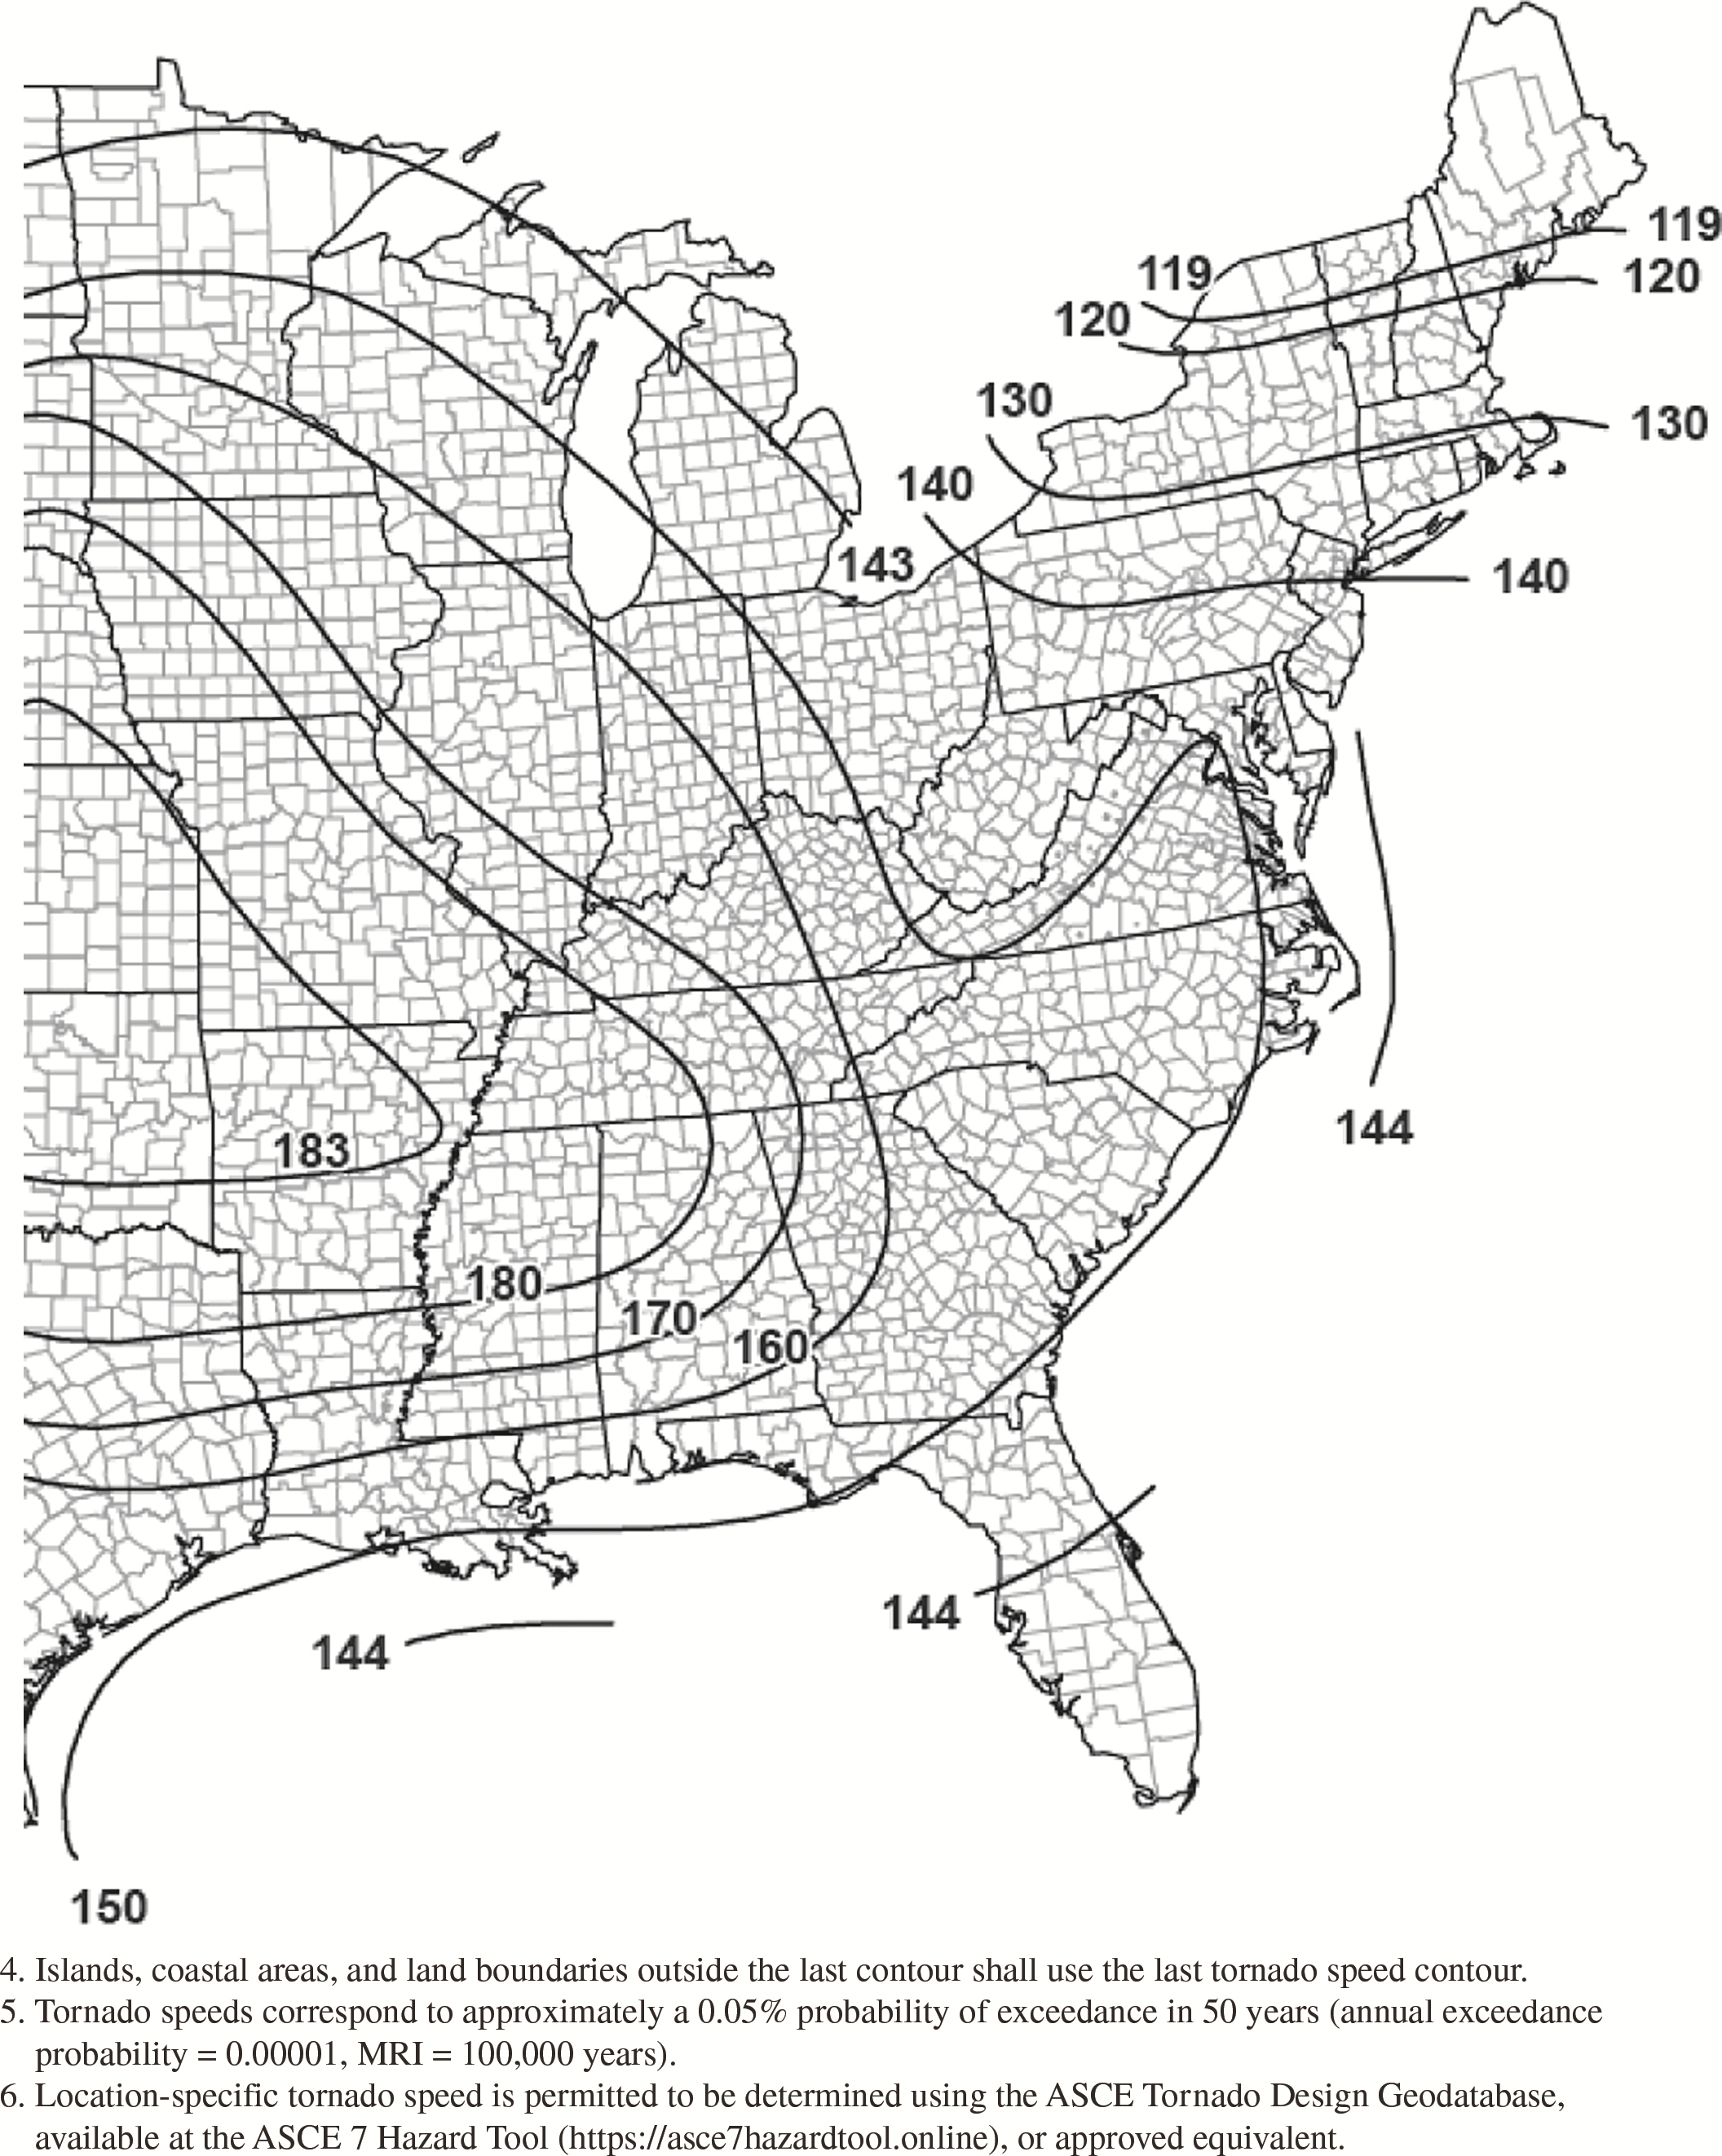
Figure G.2-2E. Tornado speeds for 100,000-year MRI for effective
plan area of 100,000 ft2
(9,290 m2).
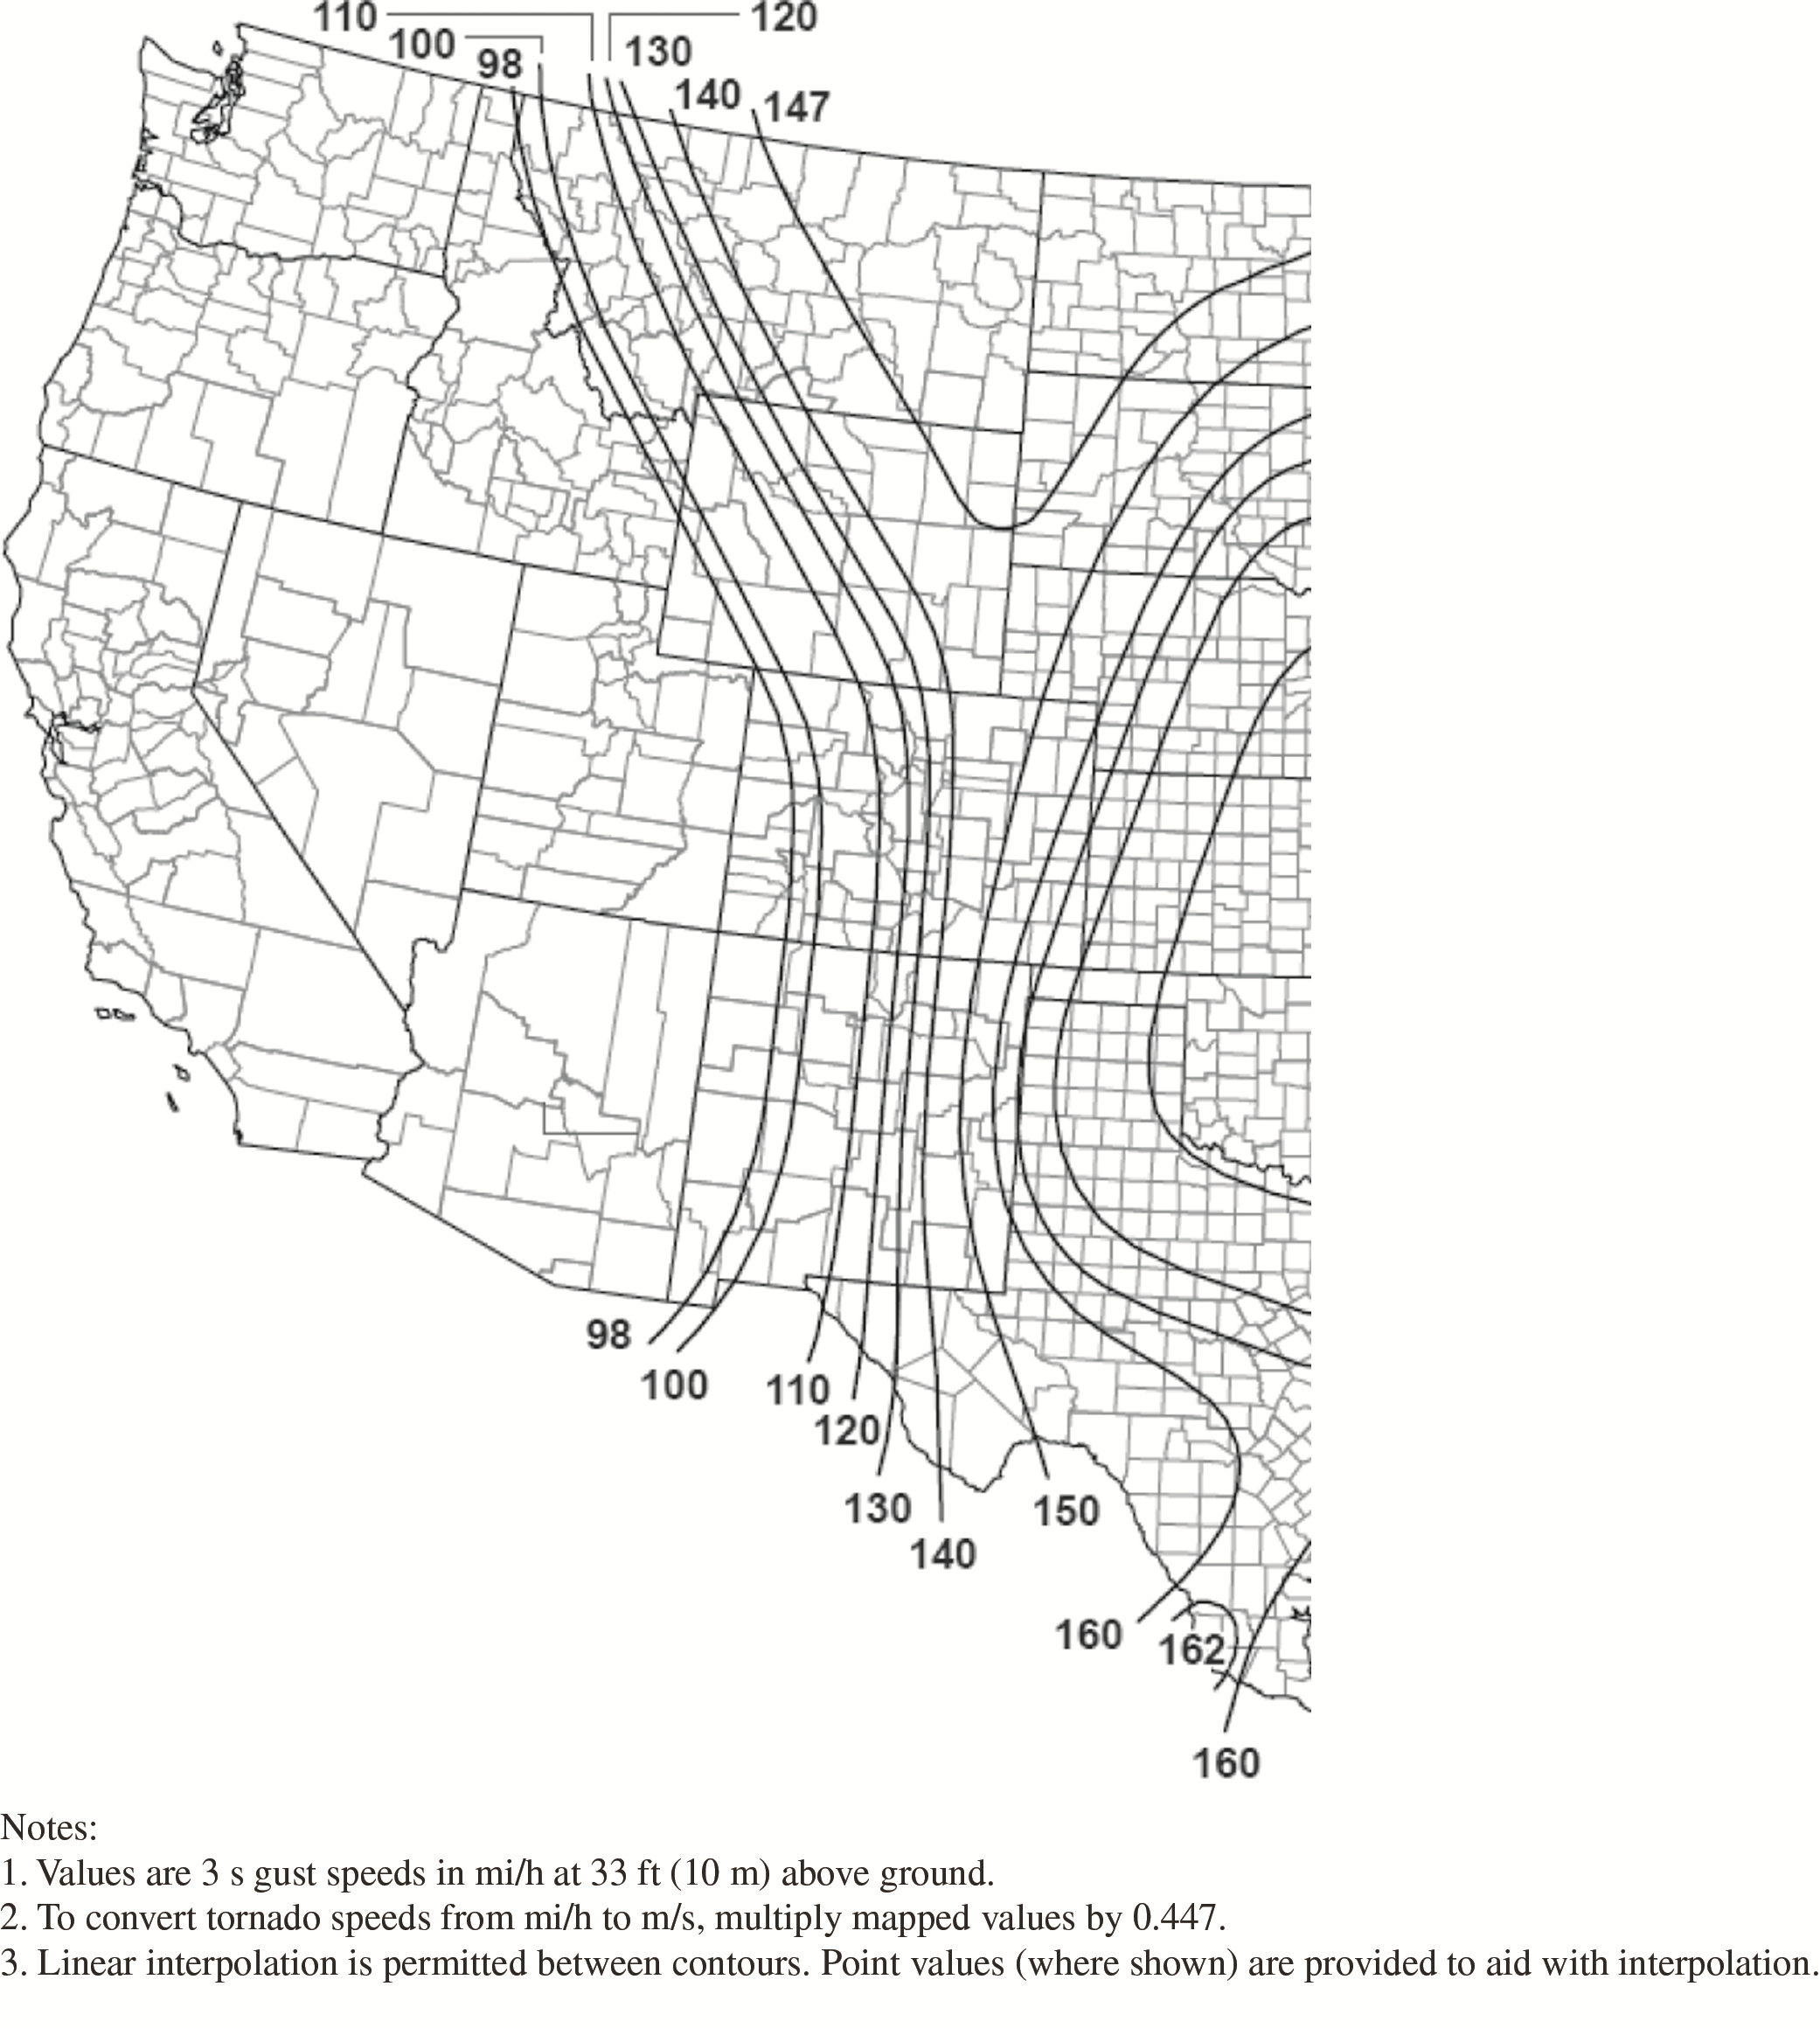
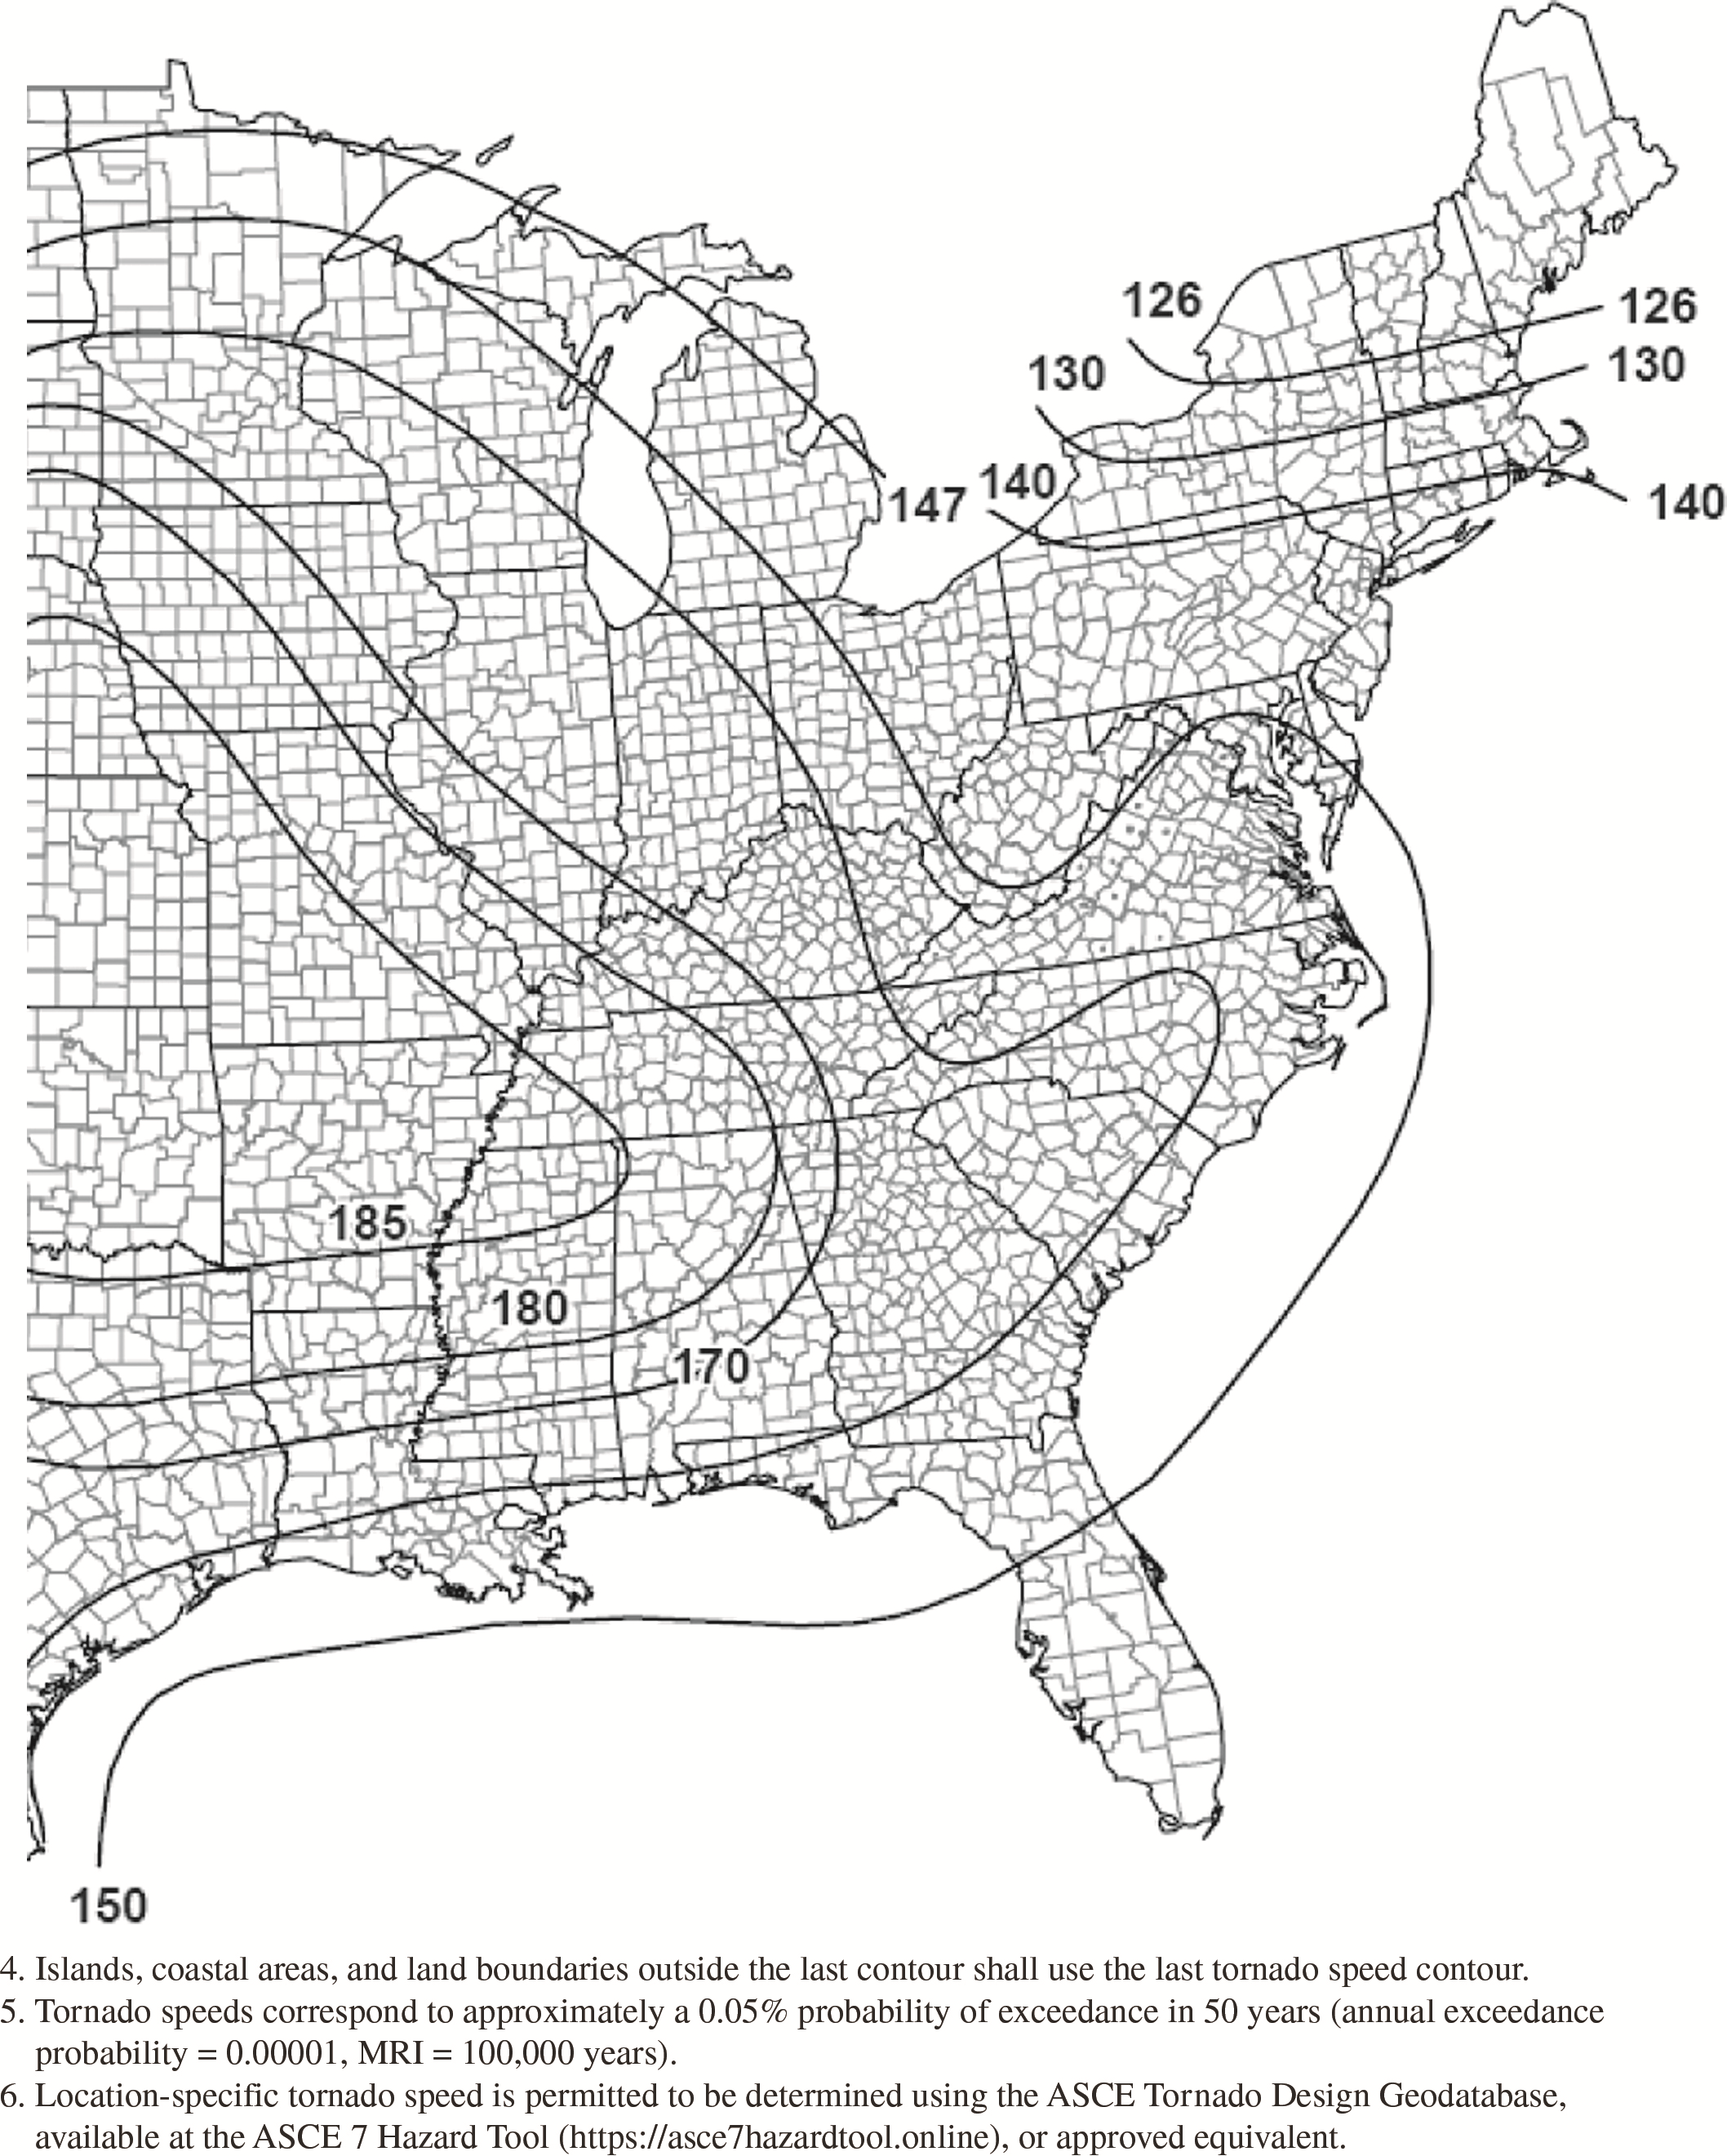
Figure G.2-2F. Tornado speeds for 100,000-year MRI for effective
plan area of 250,000 ft2
(23,226
m2).

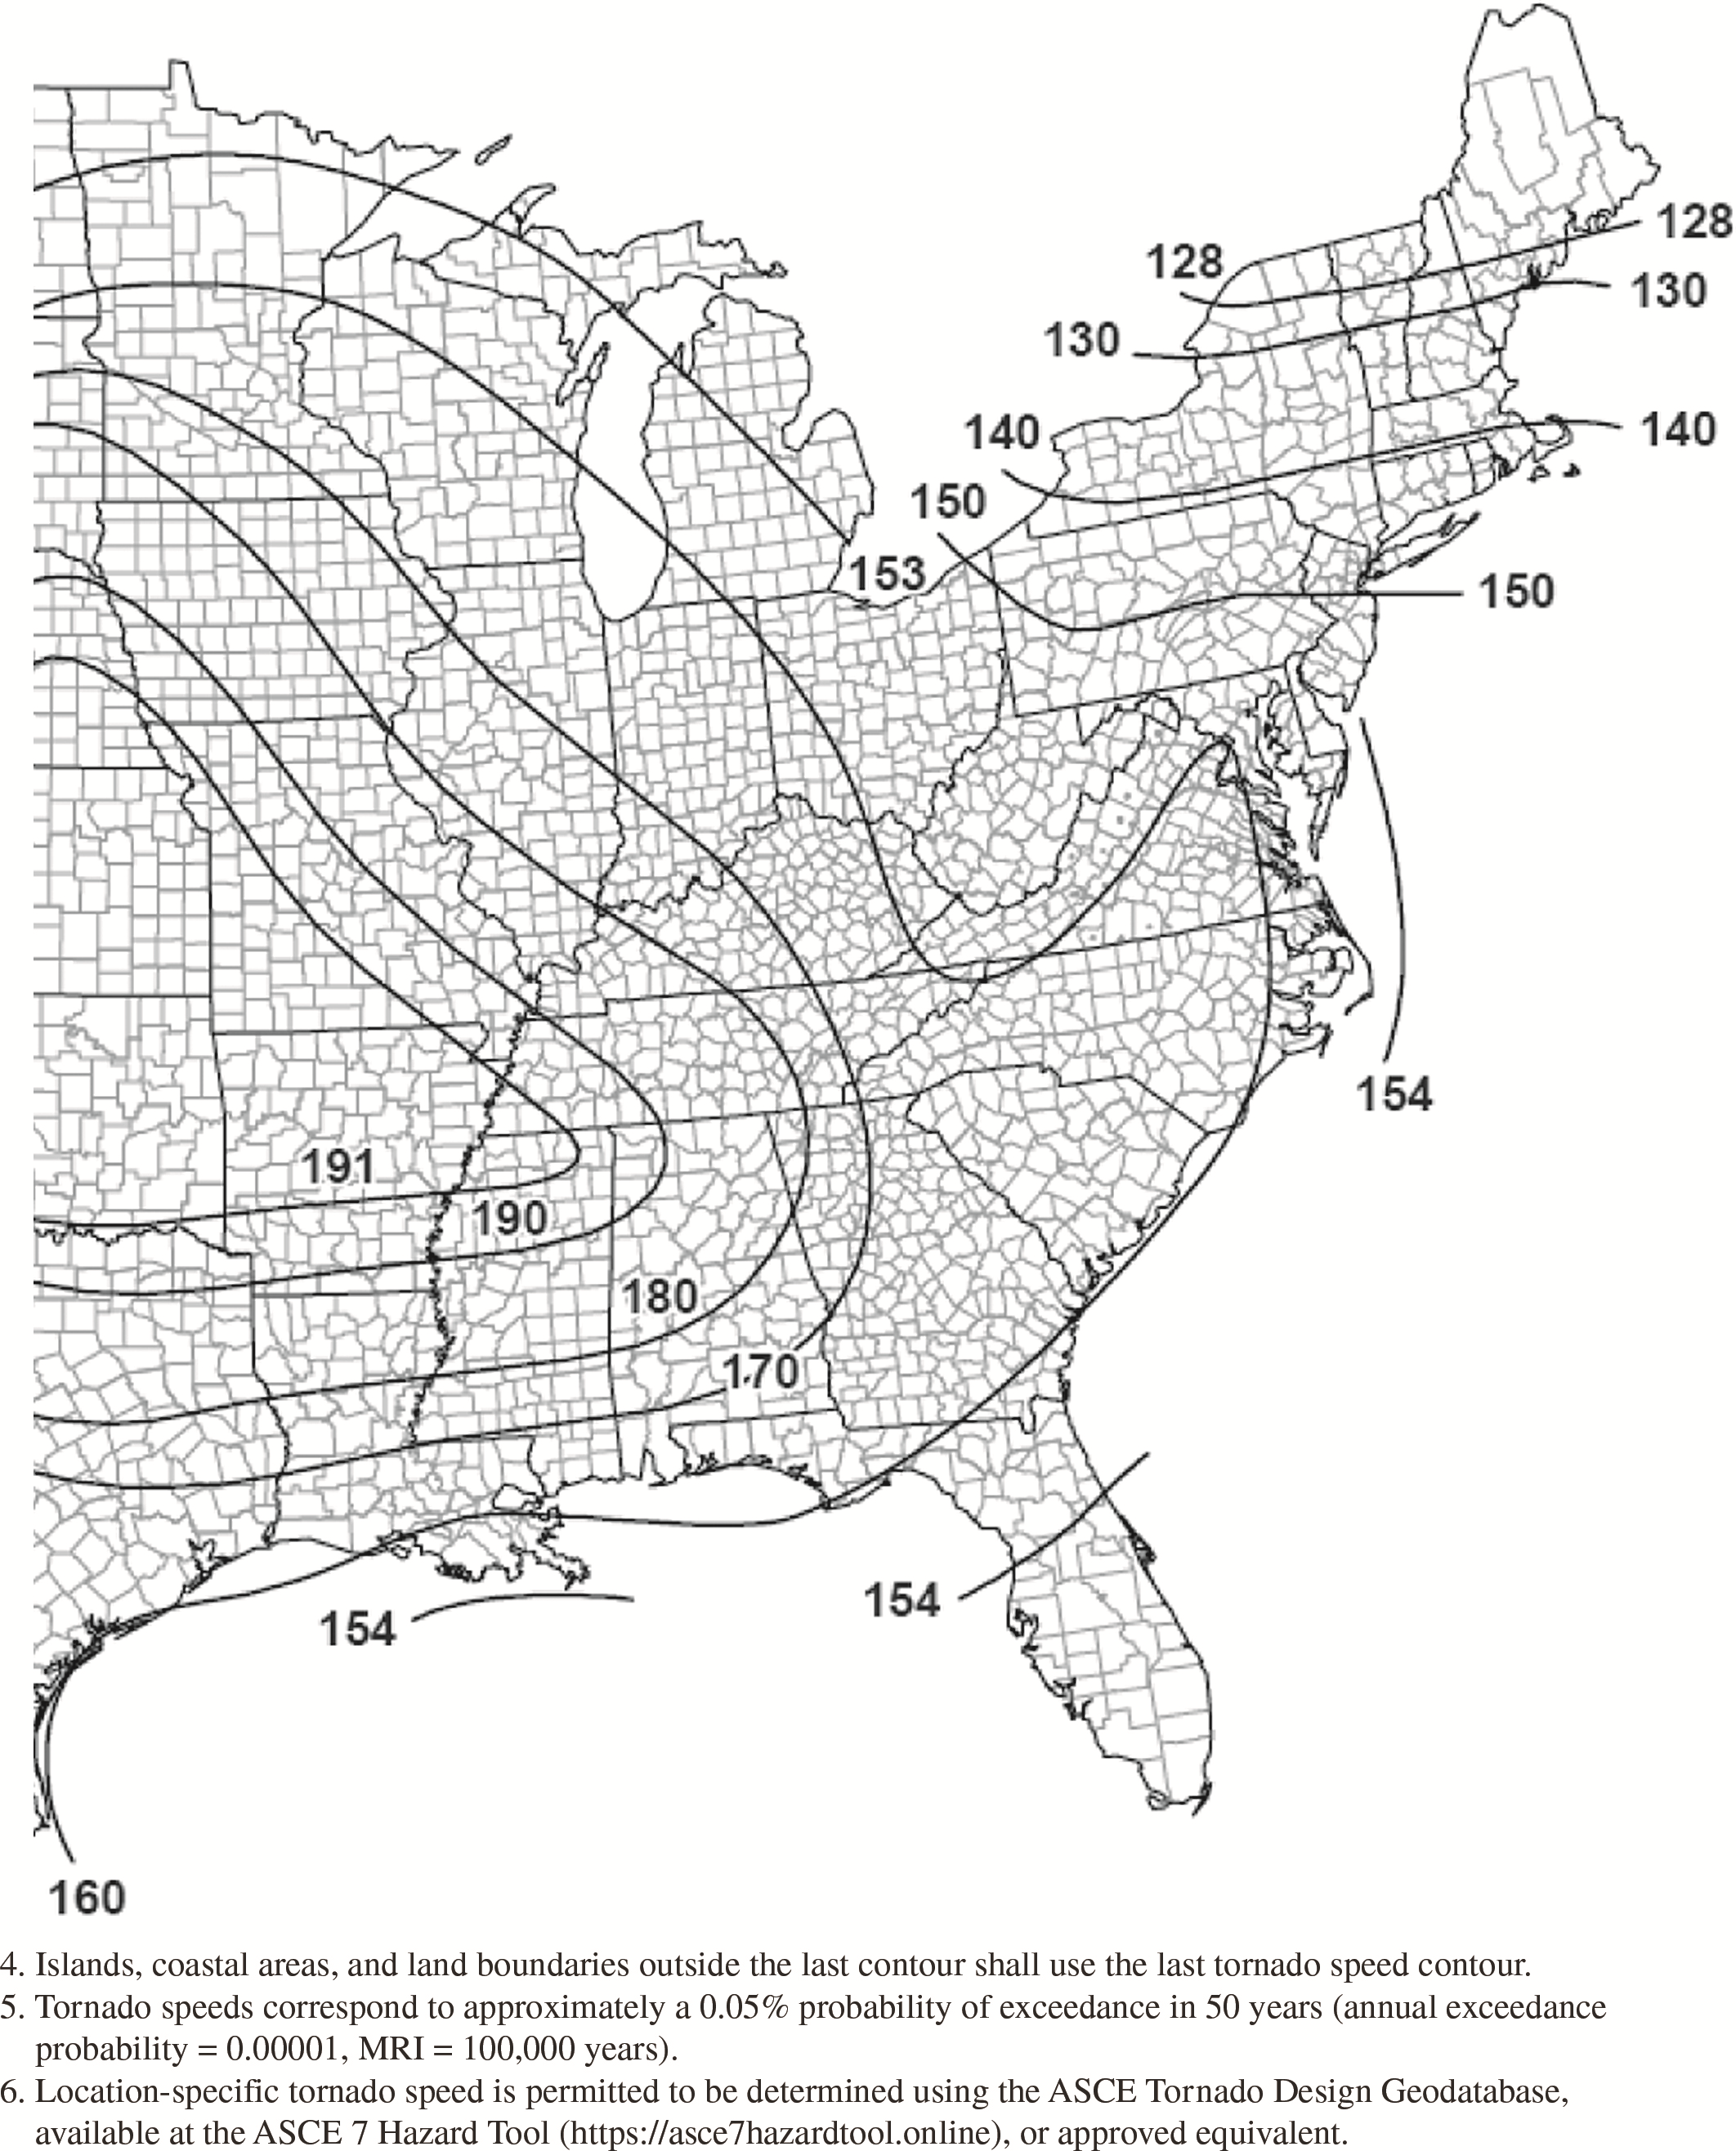
Figure G.2-2G. Tornado speeds for 100,000-year MRI for effective
plan area of 1,000,000 ft2
(92,903
m2).
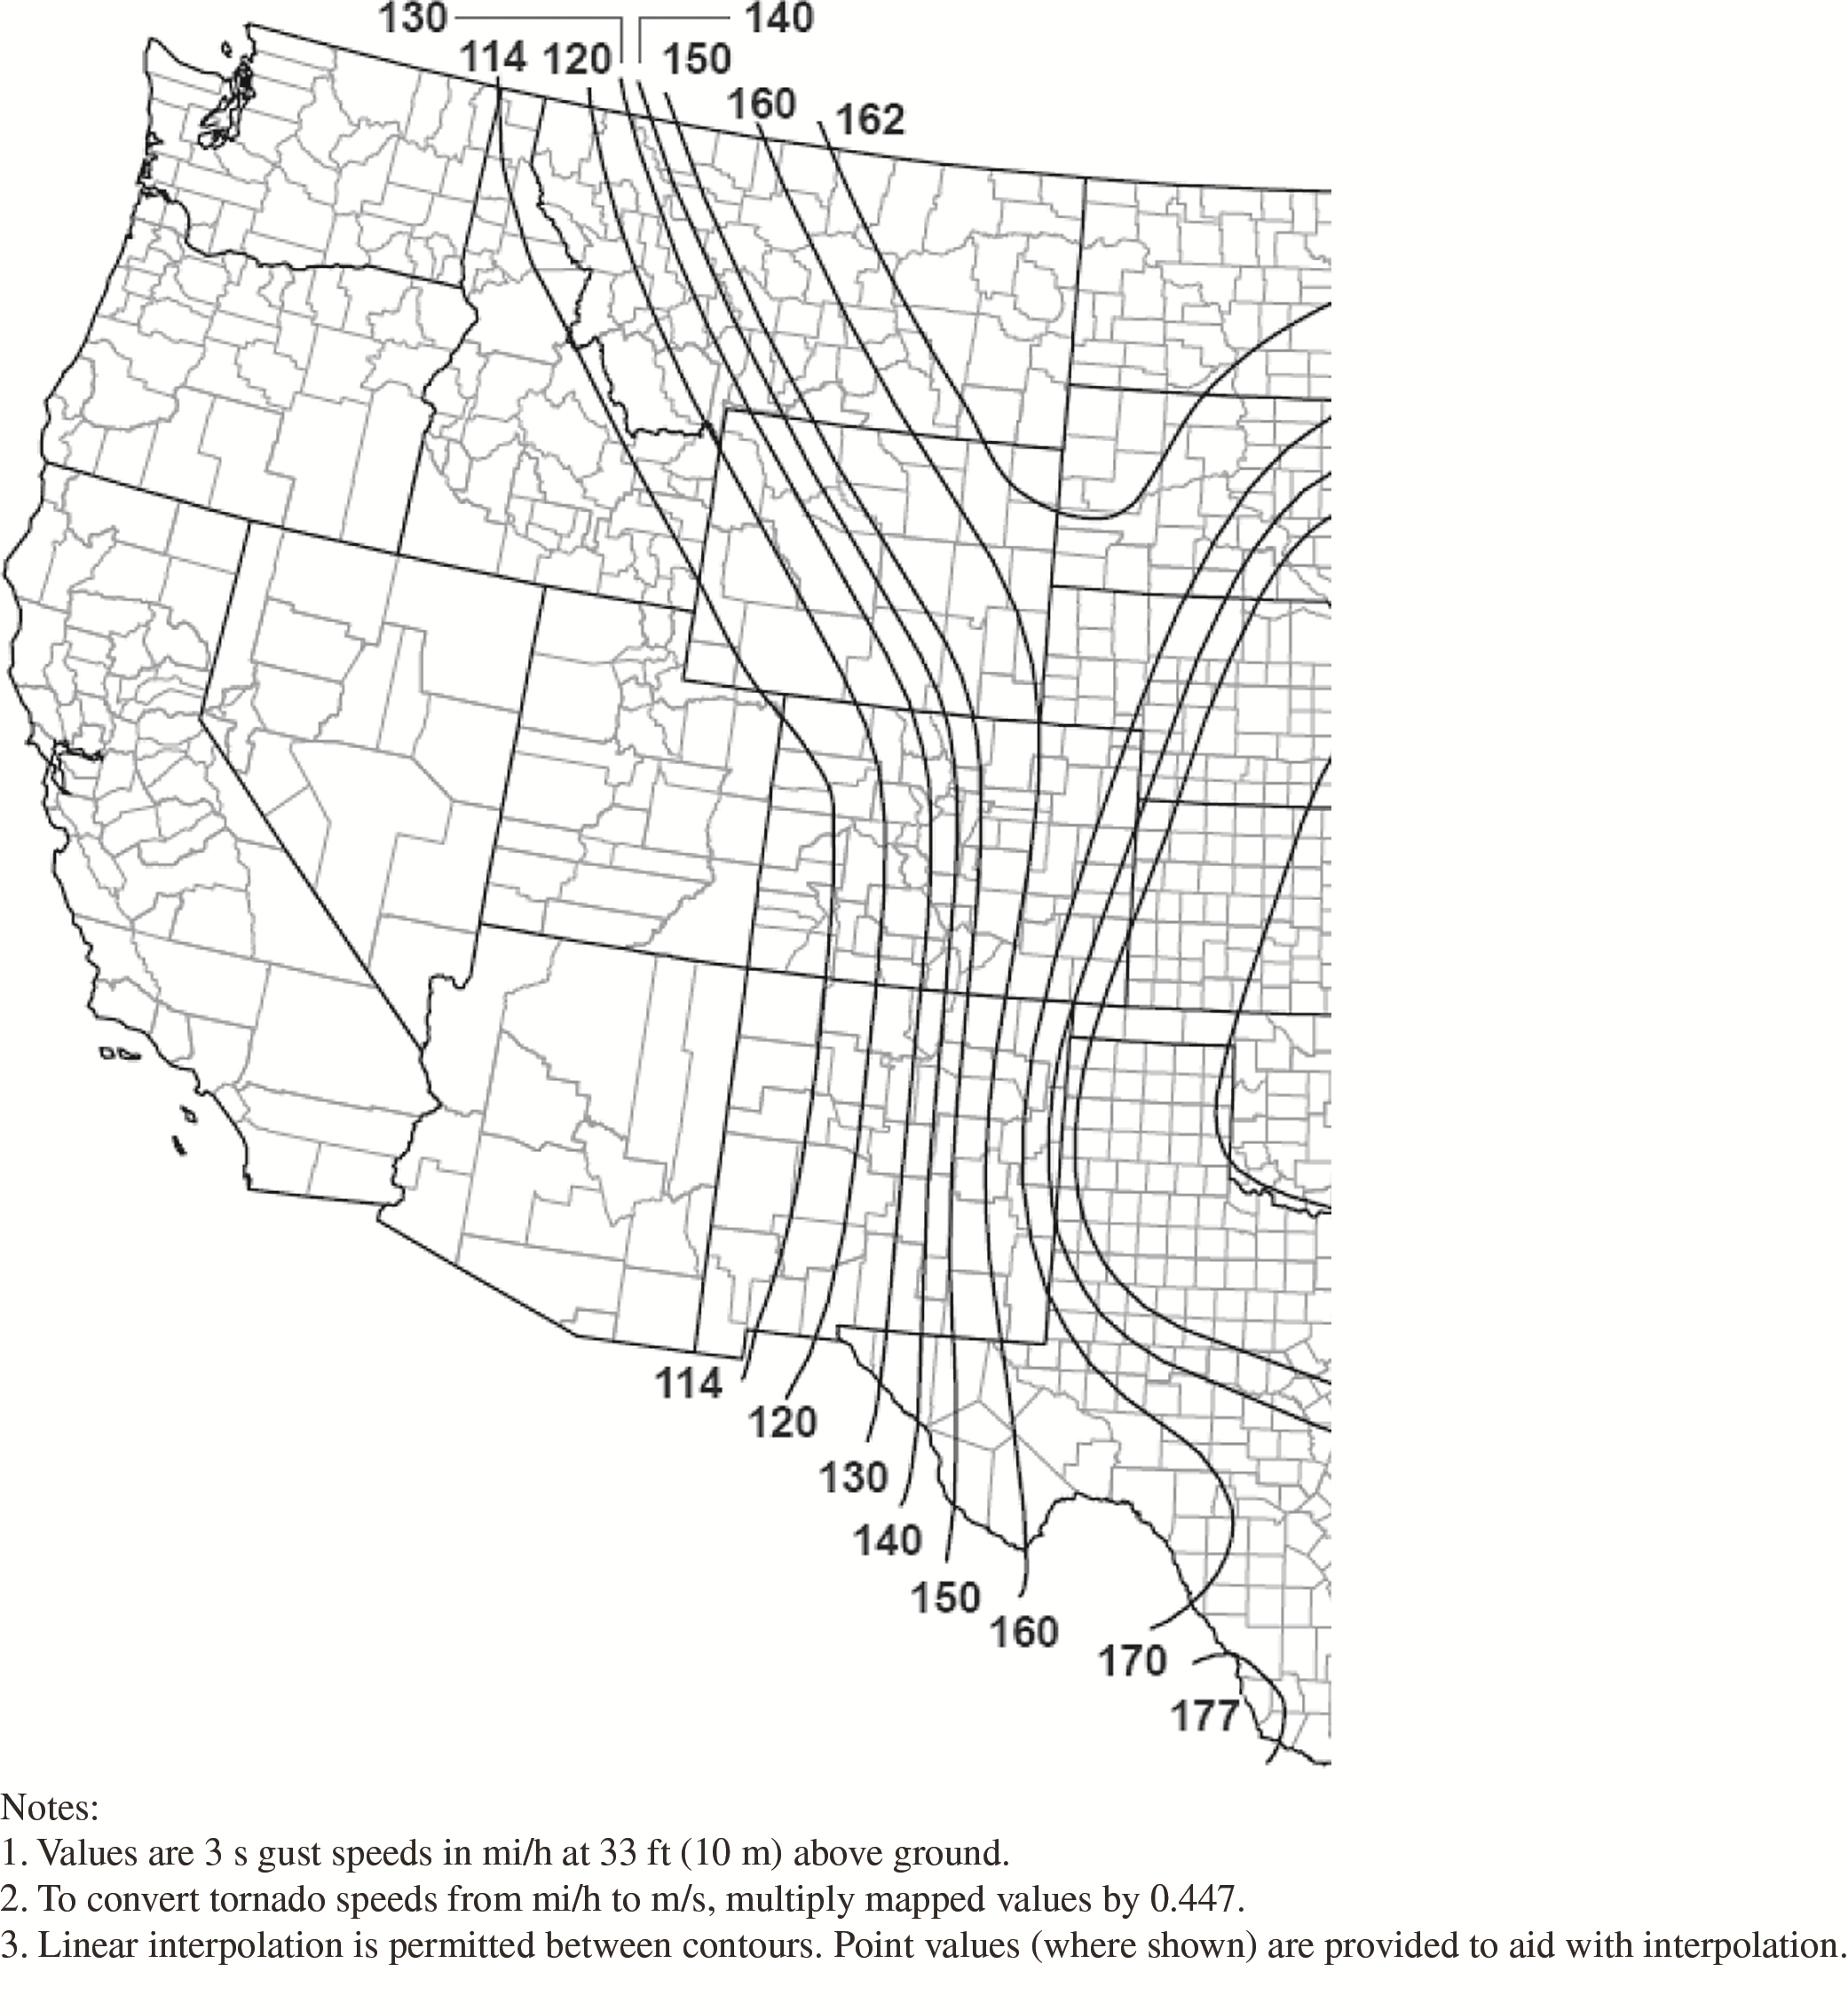
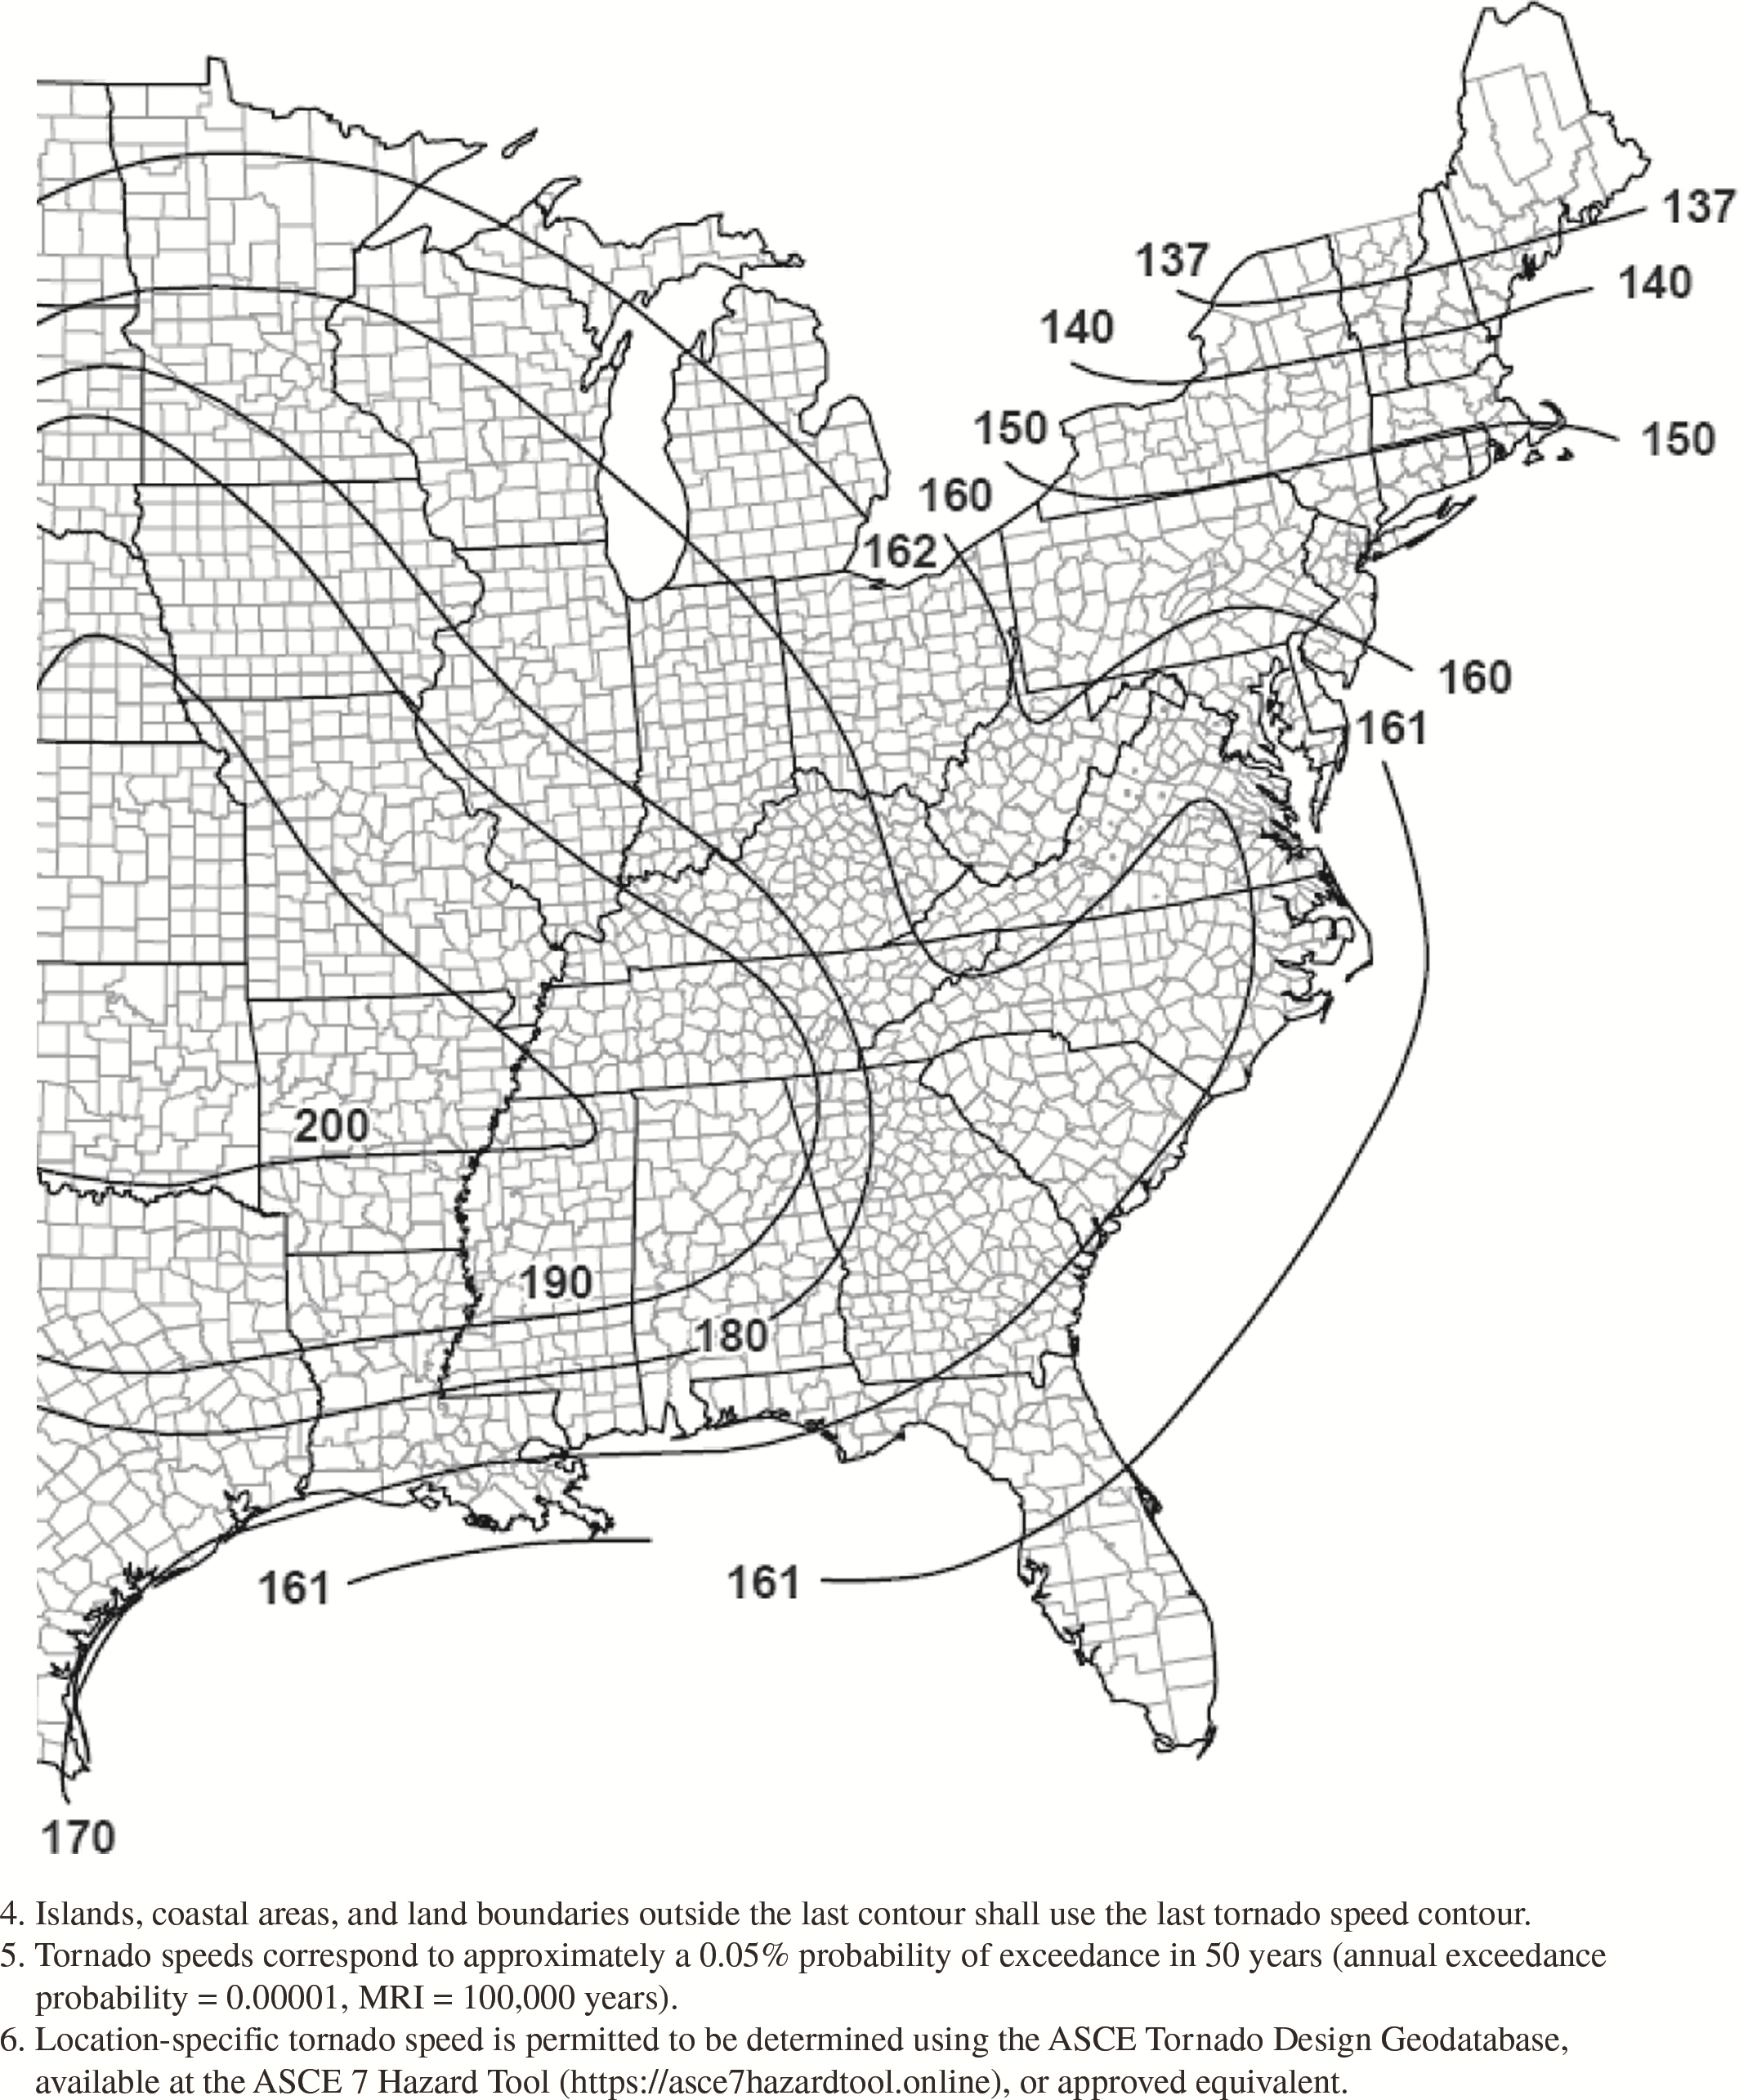
Figure G.2-2H. Tornado speeds for 100,000-year MRI for effective
plan area of 4,000,000 ft2
(371,612
m2).
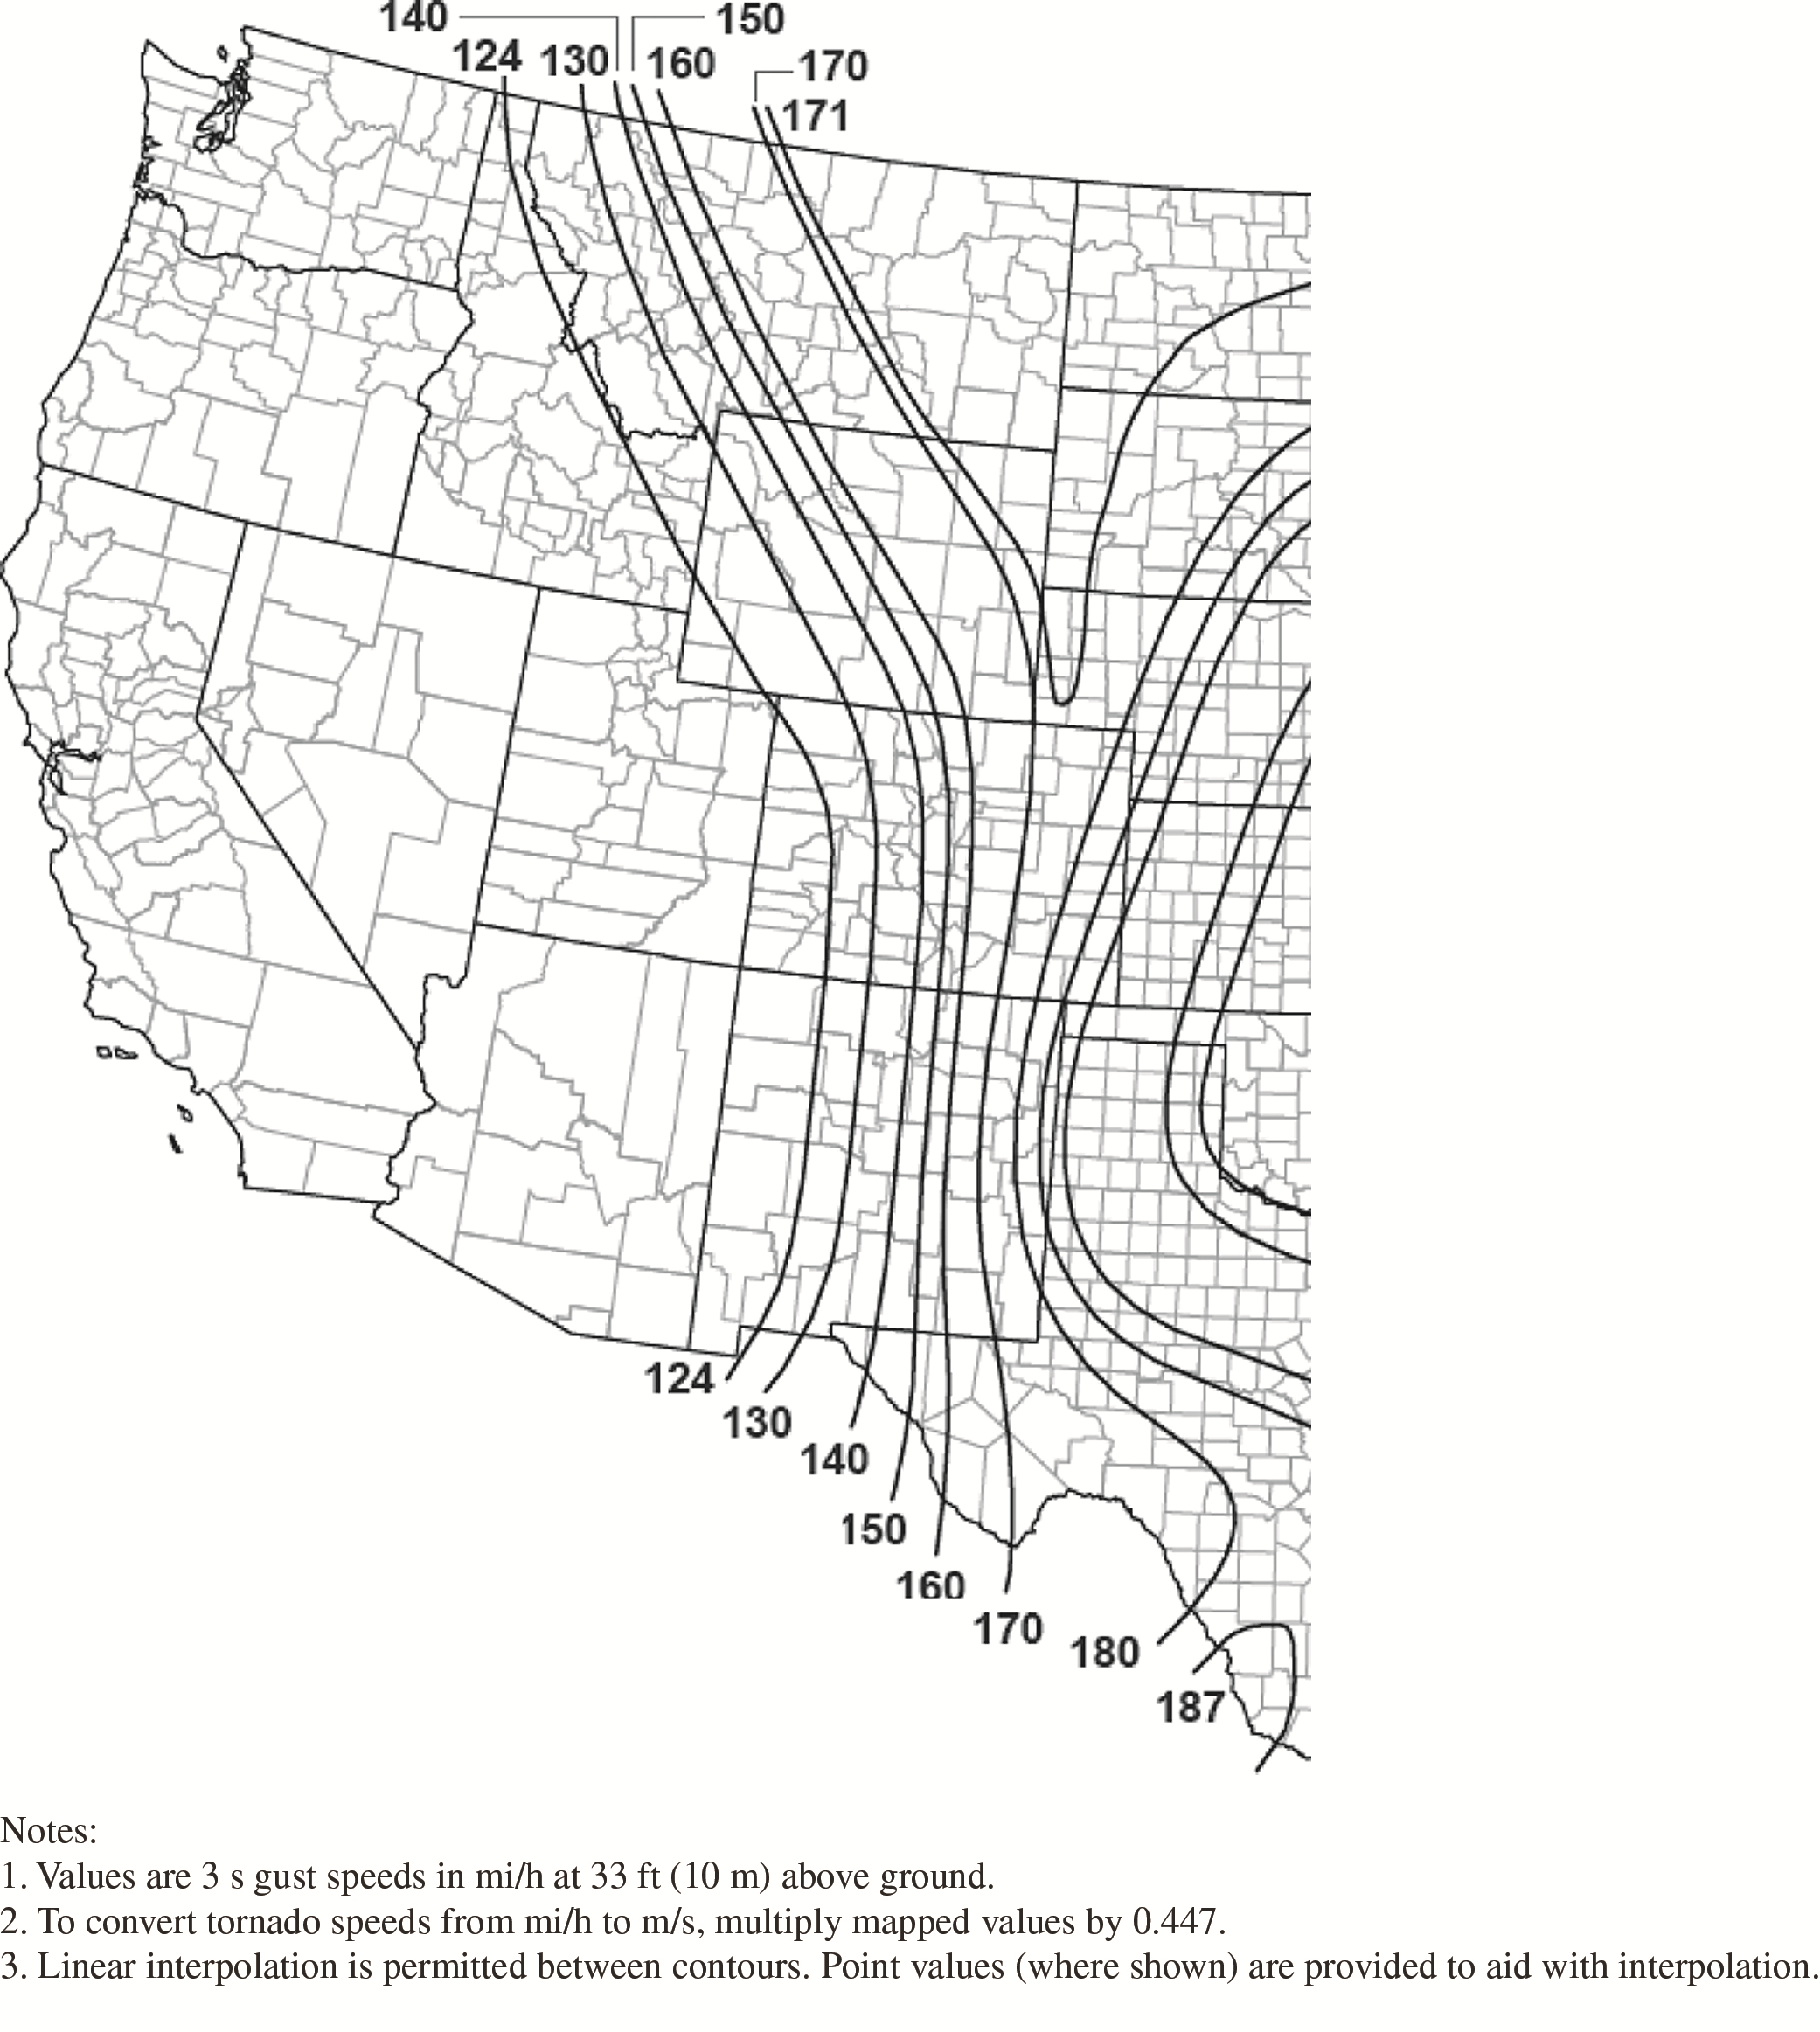
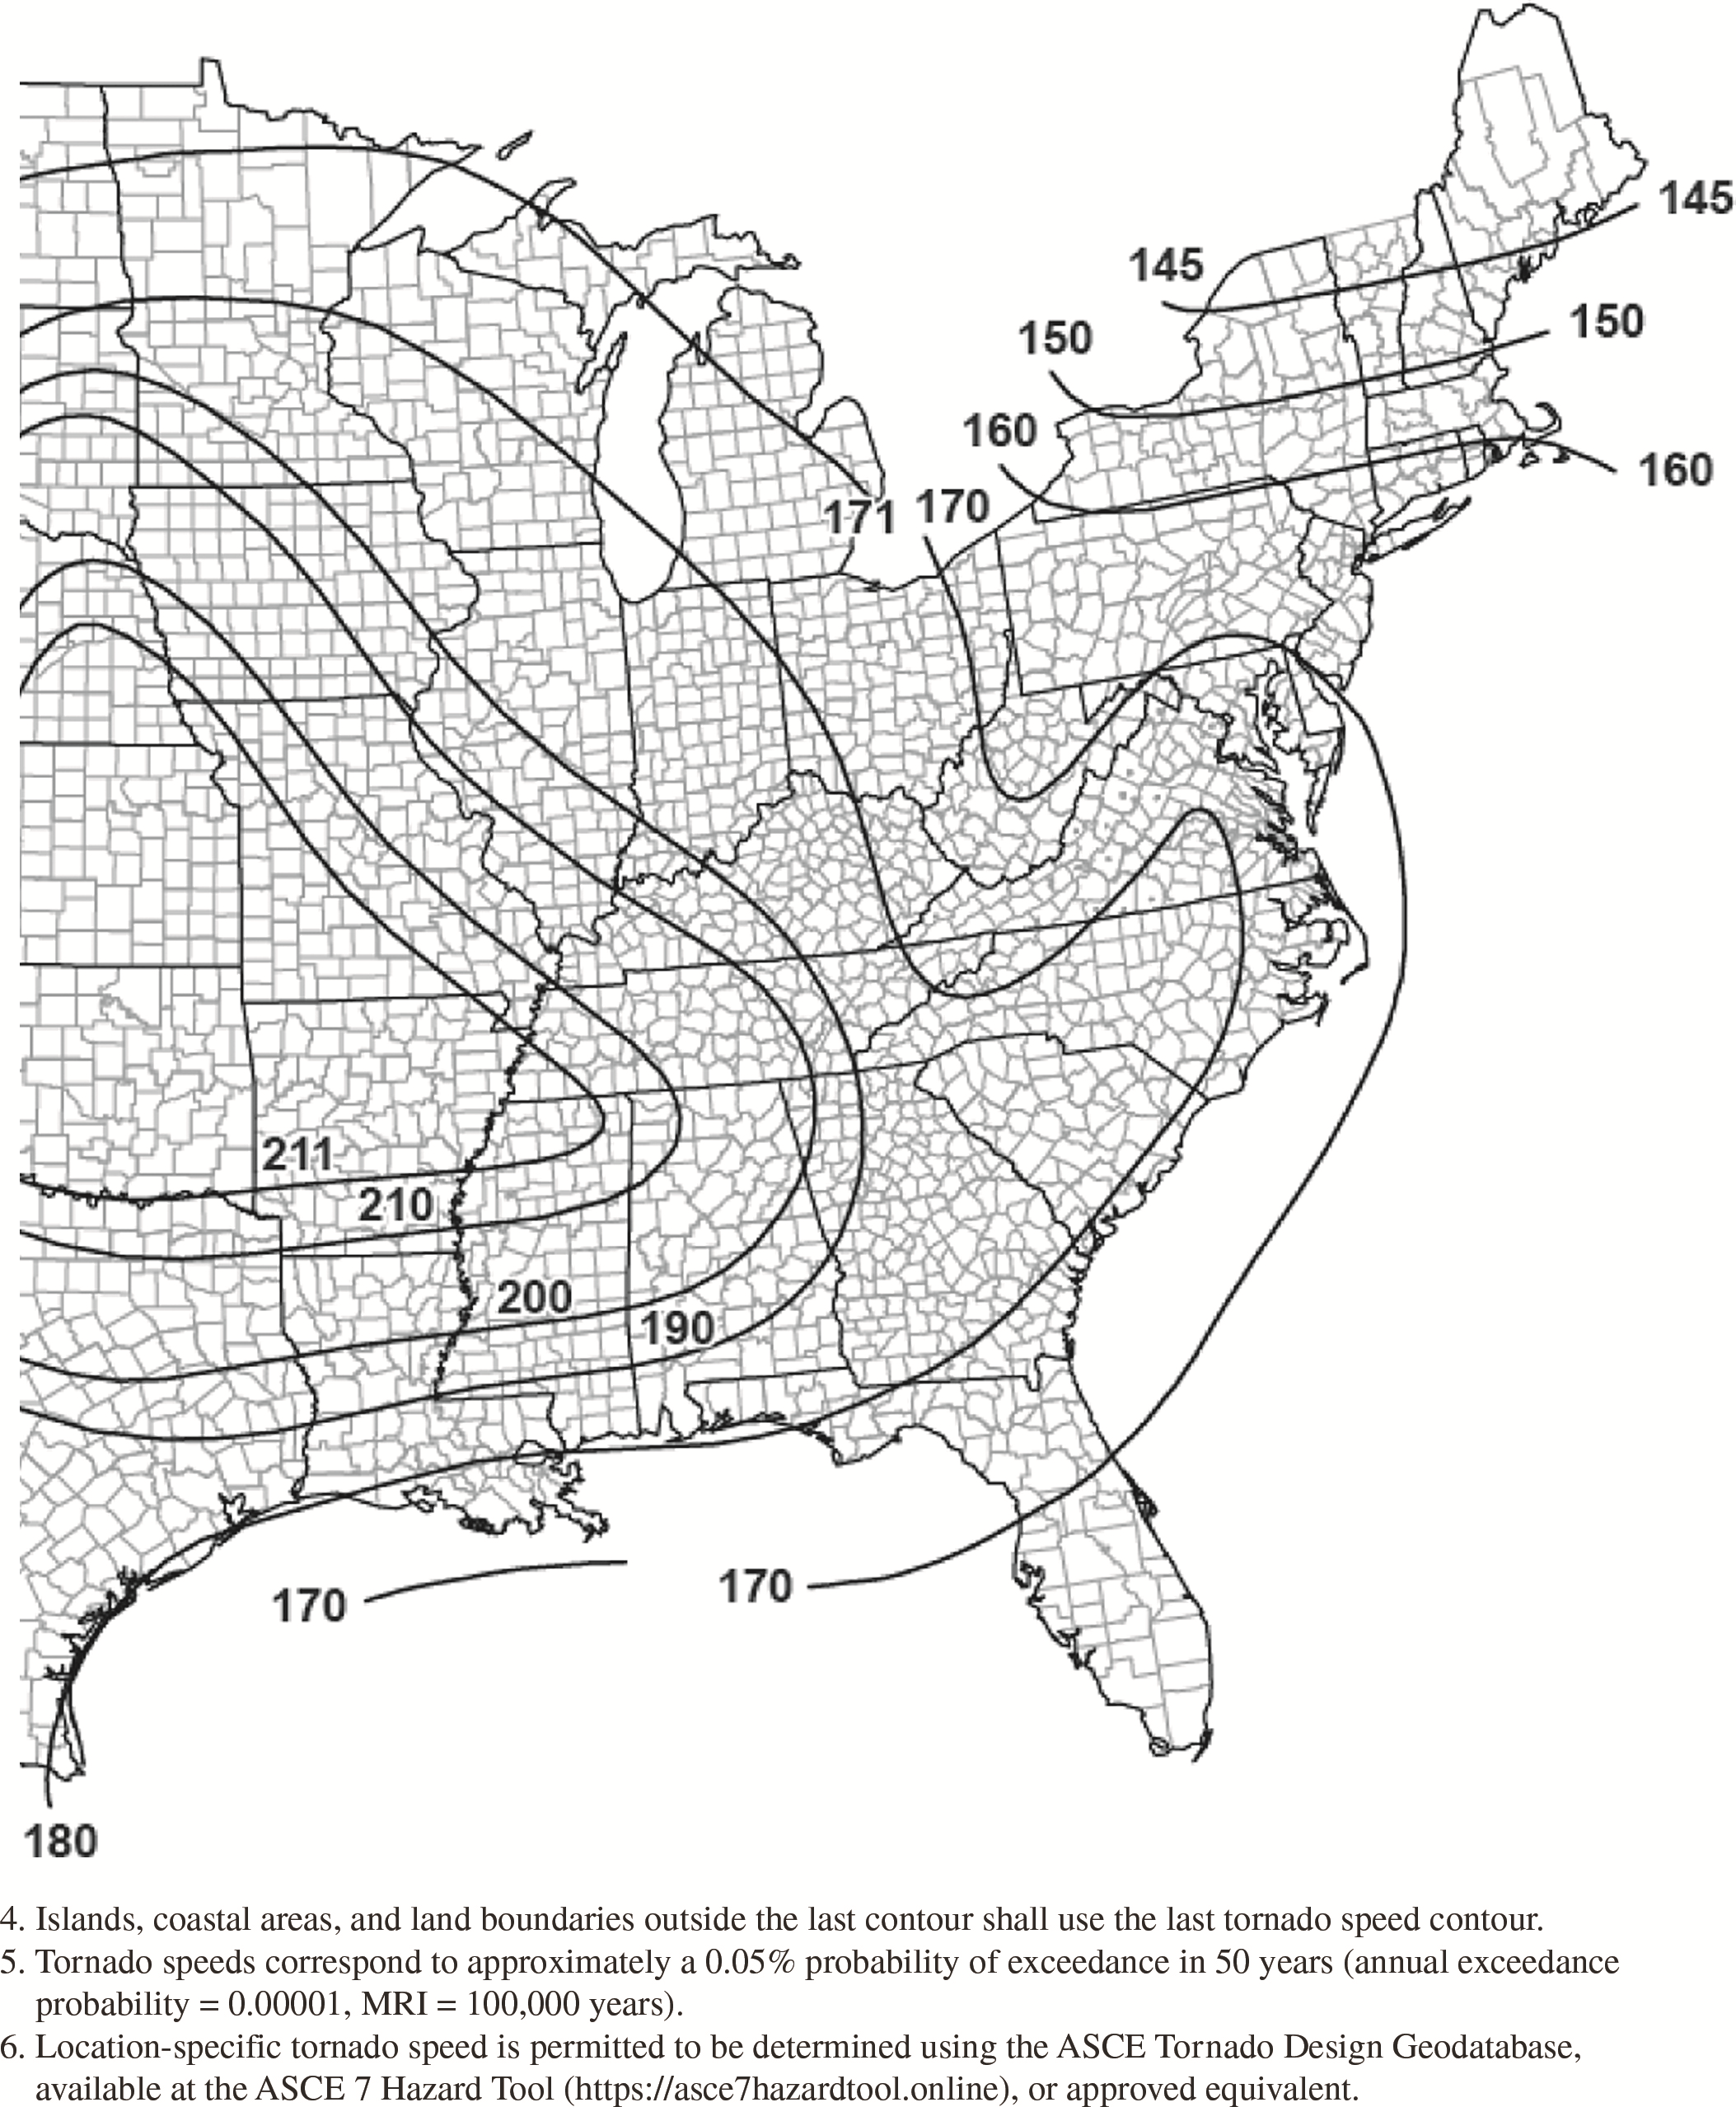
Figure G.2-3A. Tornado speeds for 1,000,000-year MRI for
effective plan area of 1
ft2
(0.1 m2).
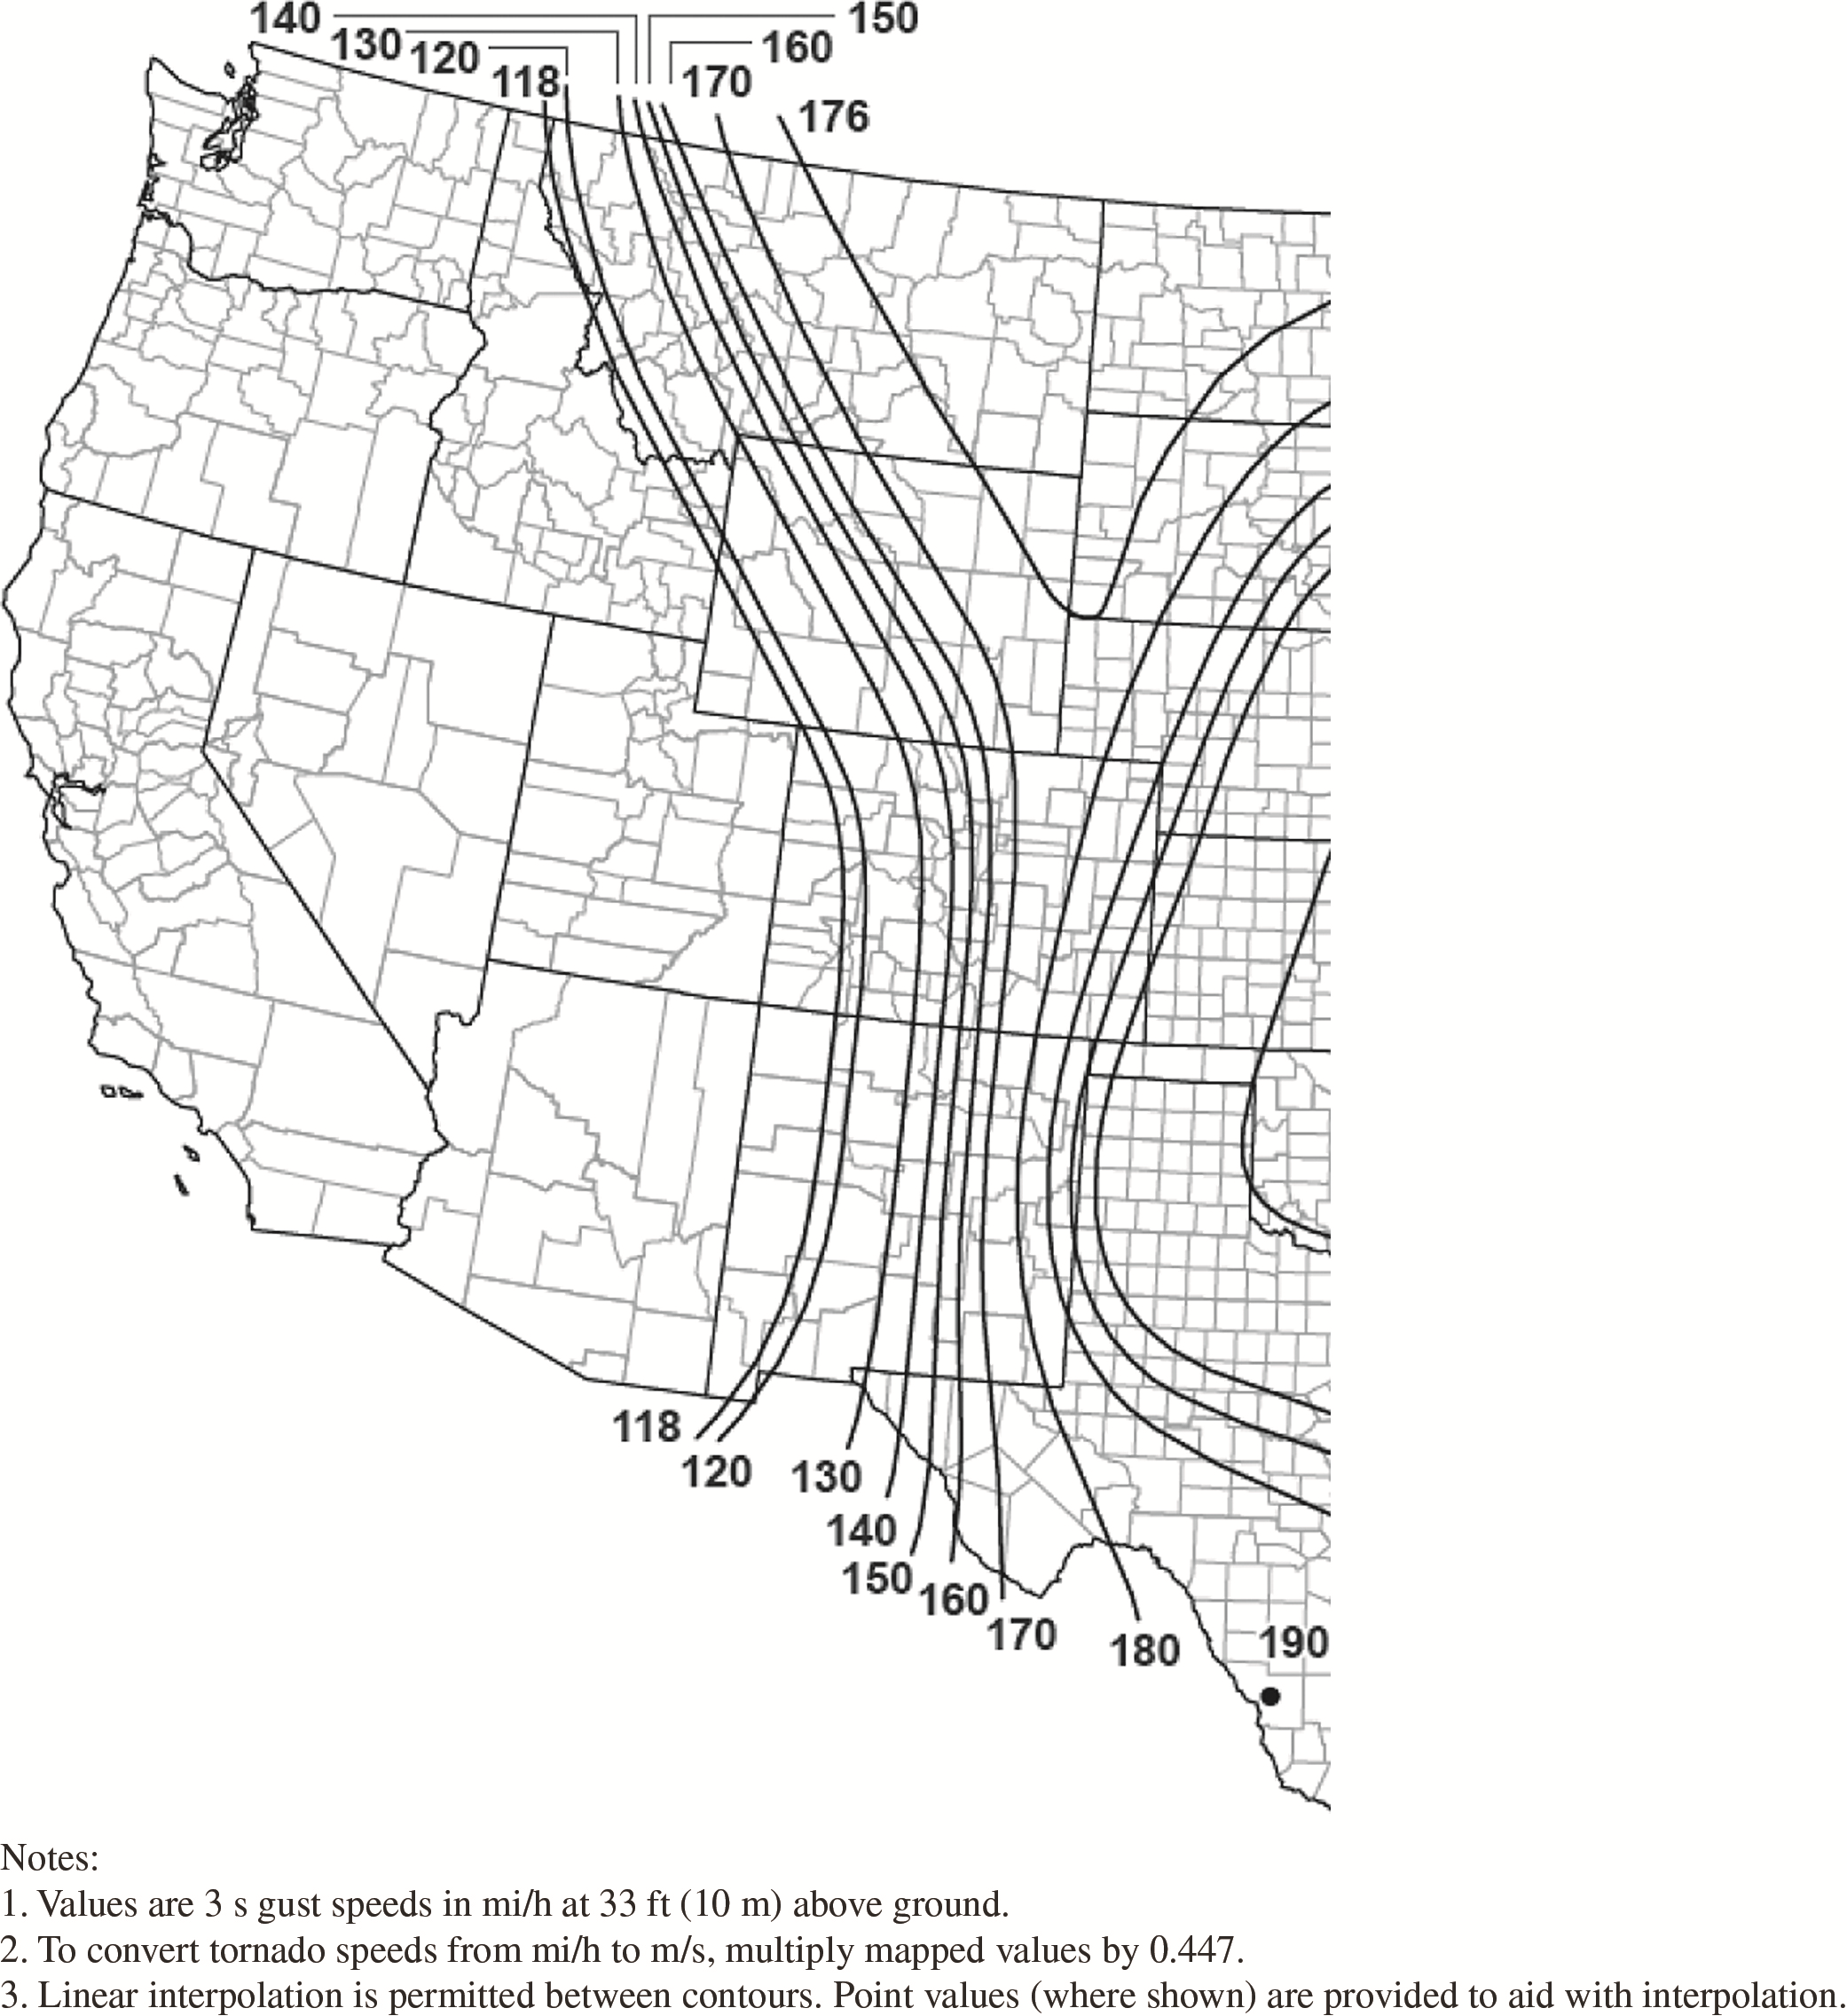
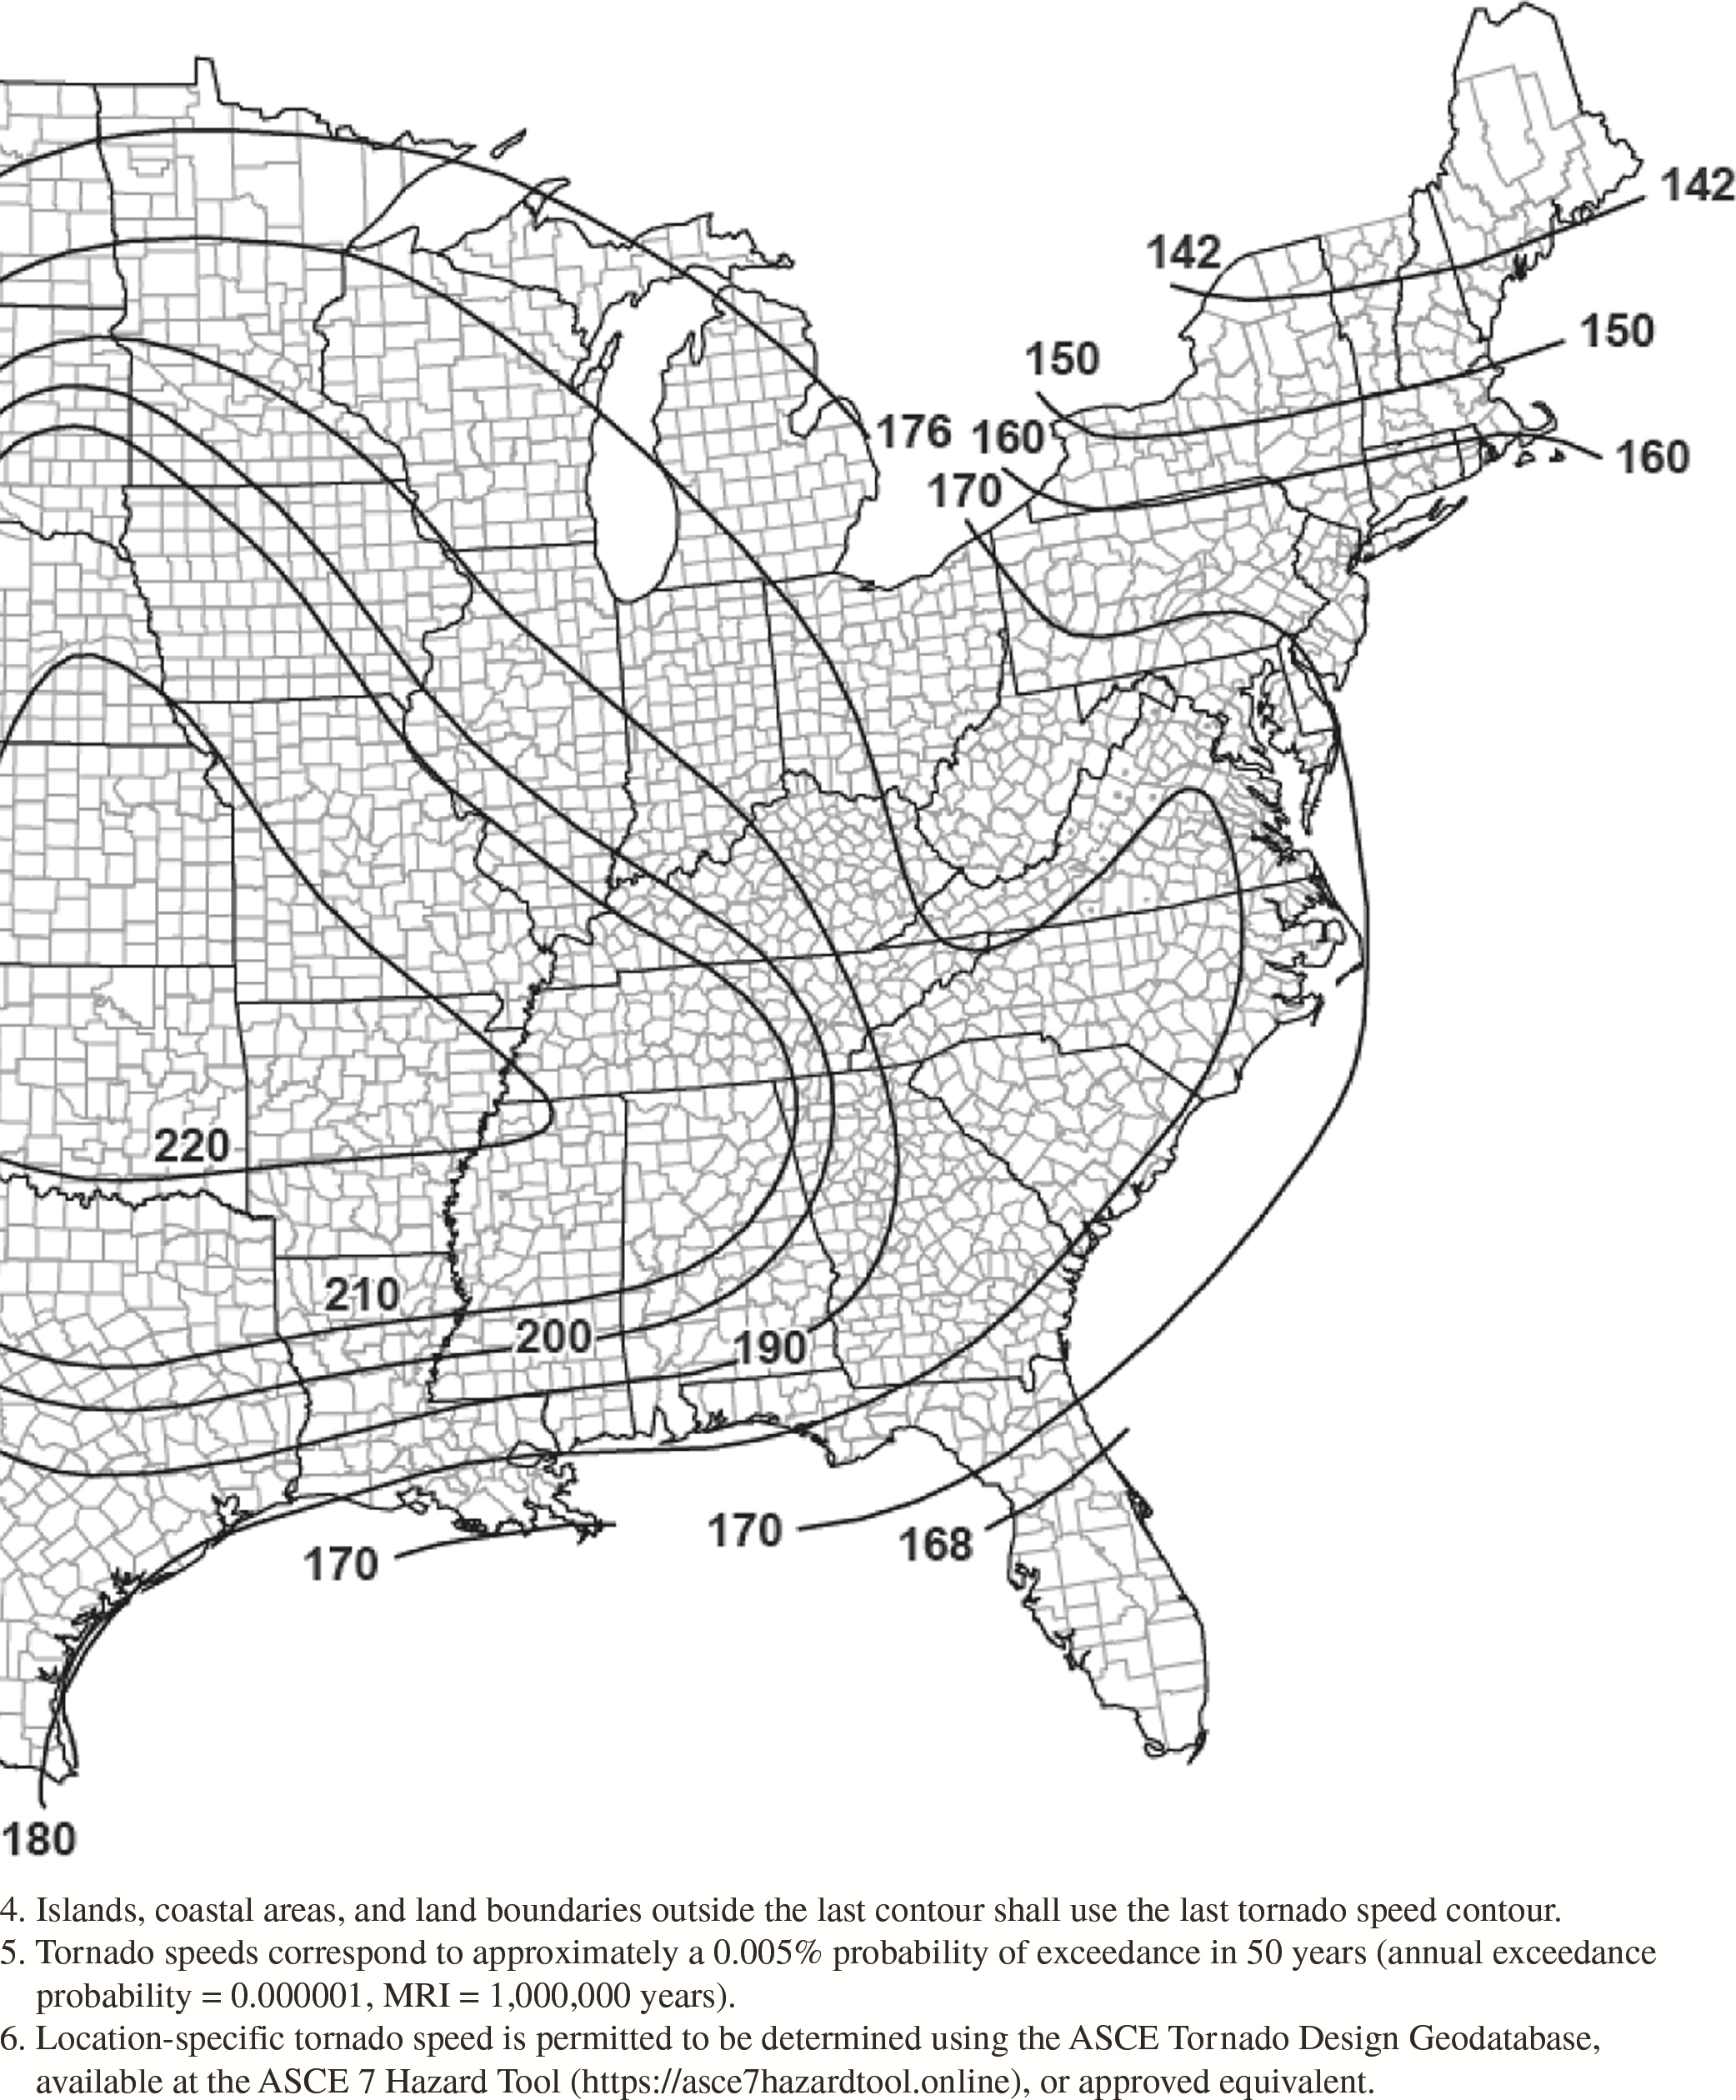
Figure G.2-3B. Tornado speeds for 1,000,000-year MRI for
effective plan area of 2,000
ft2
(186 m2).
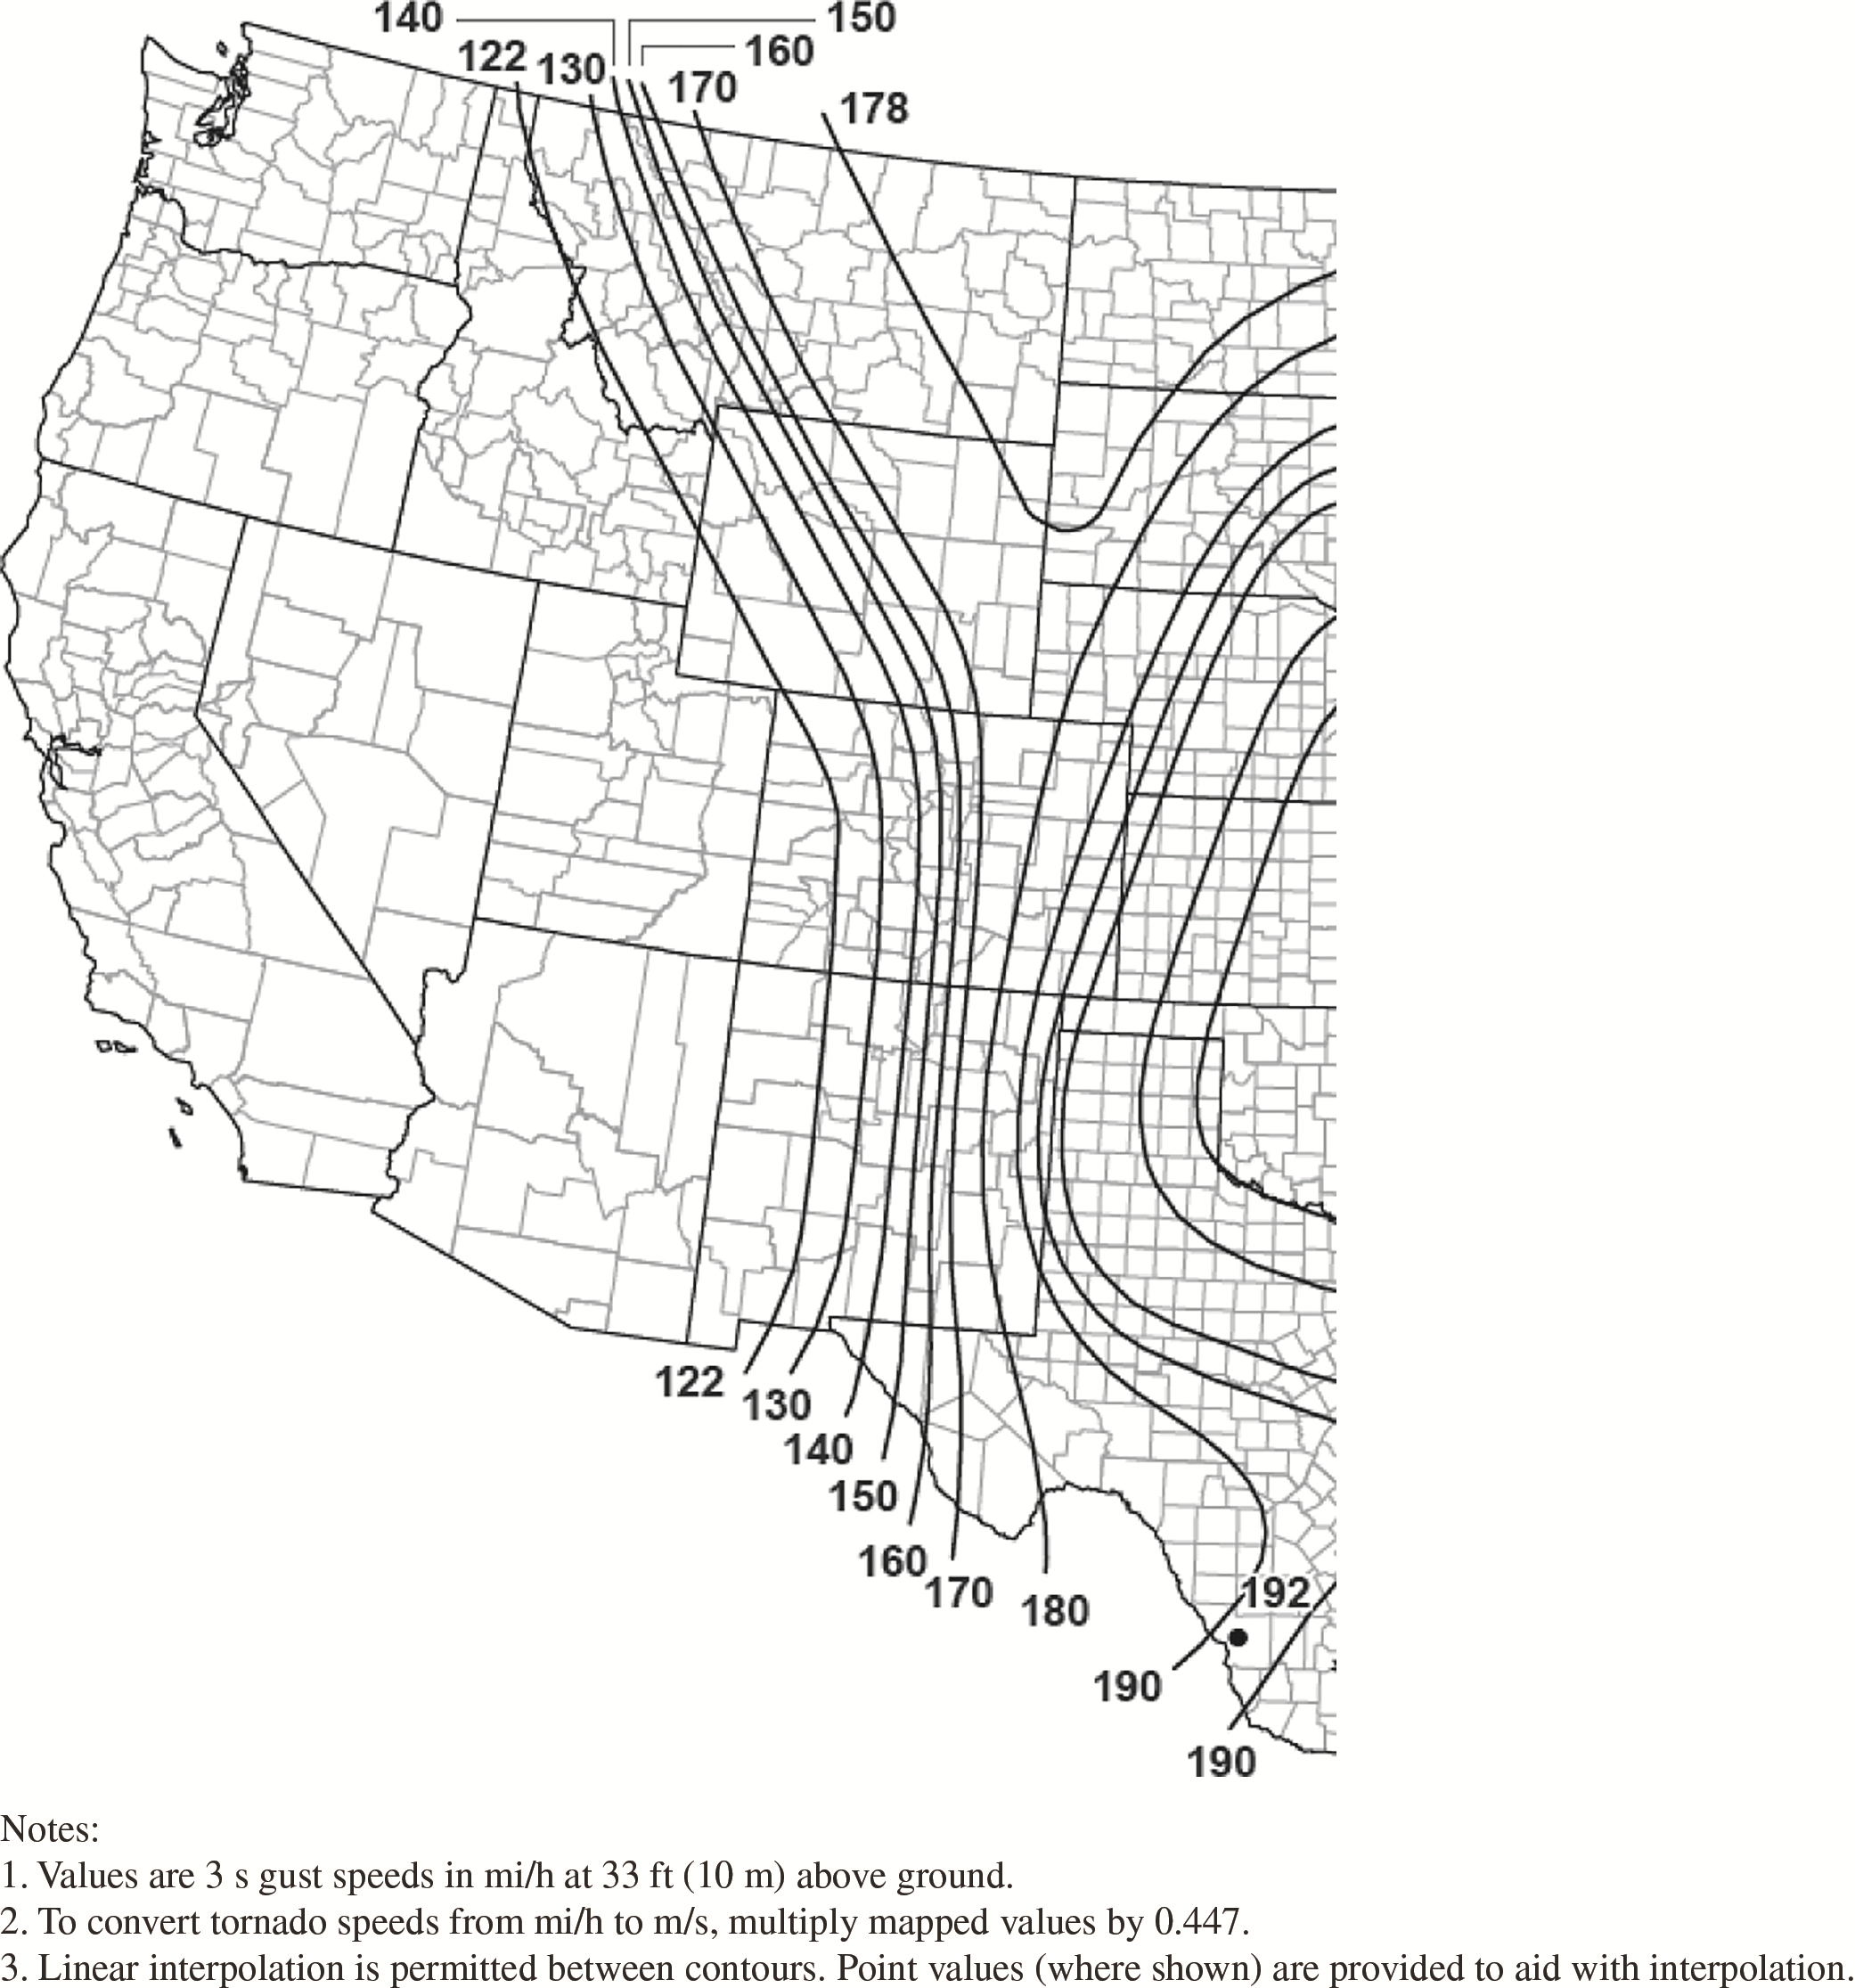
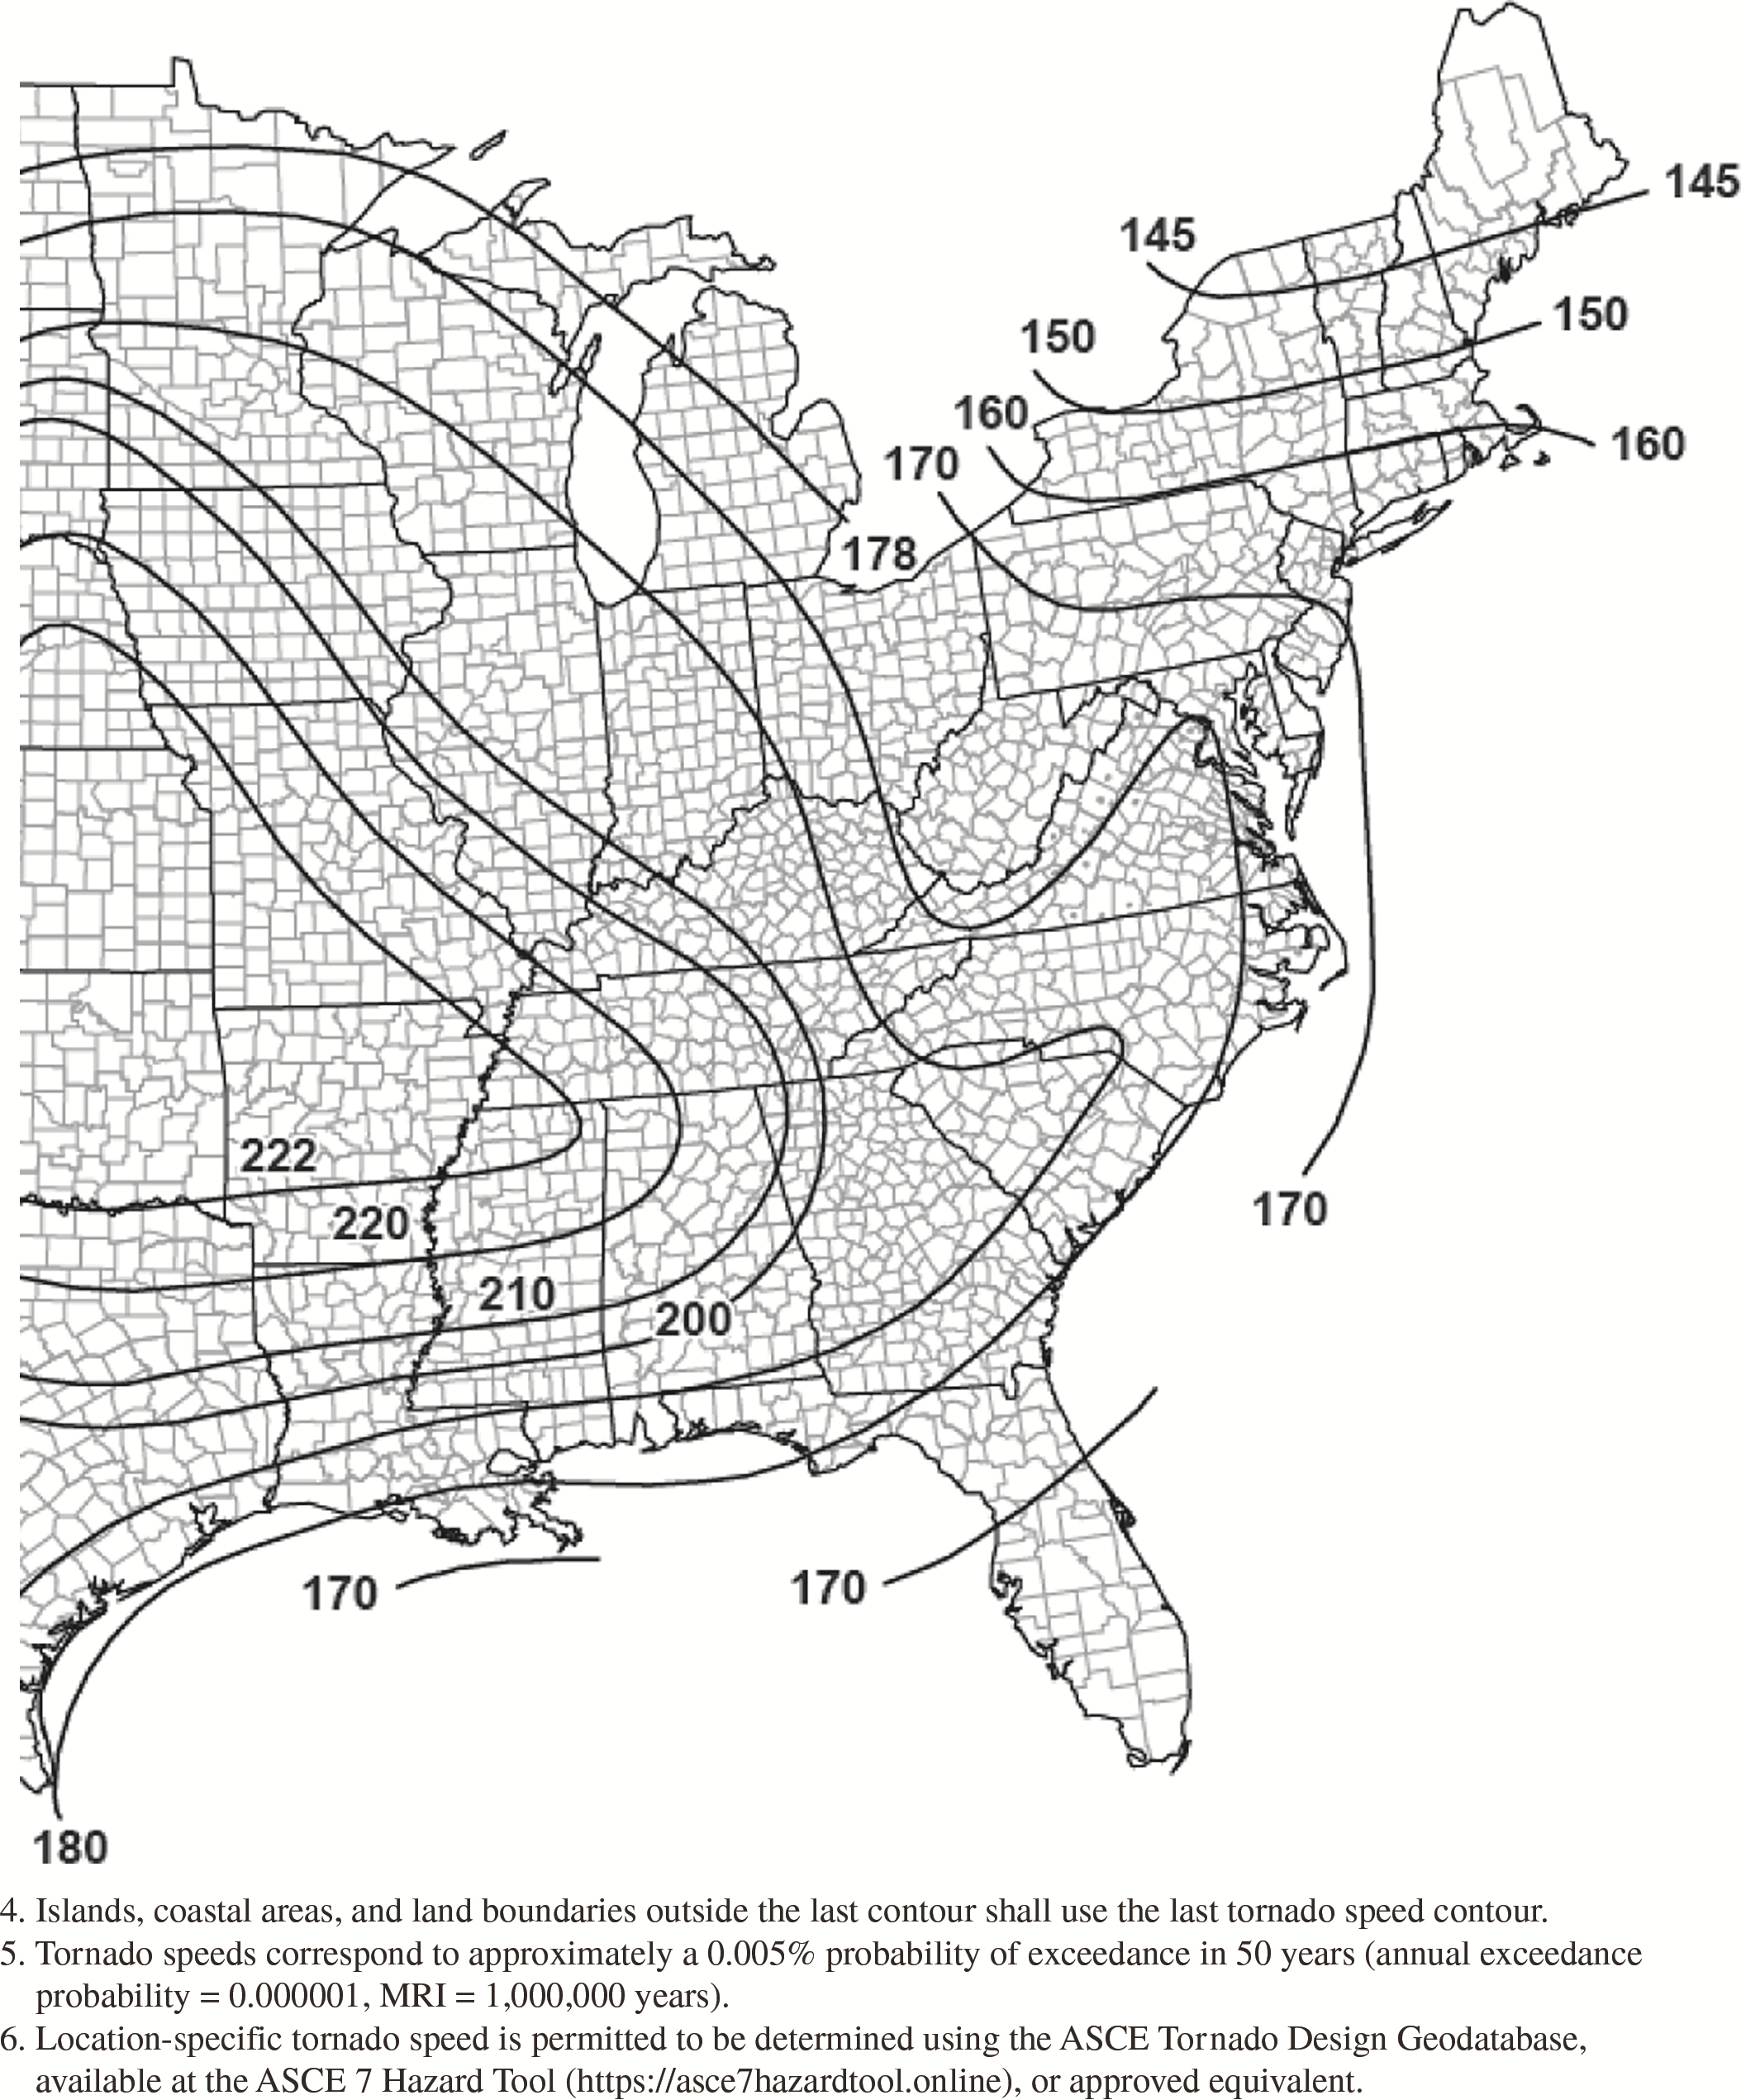
Figure G.2-3C. Tornado speeds for 1,000,000-year MRI for
effective plan area of 10,000
ft2
(929 m2).
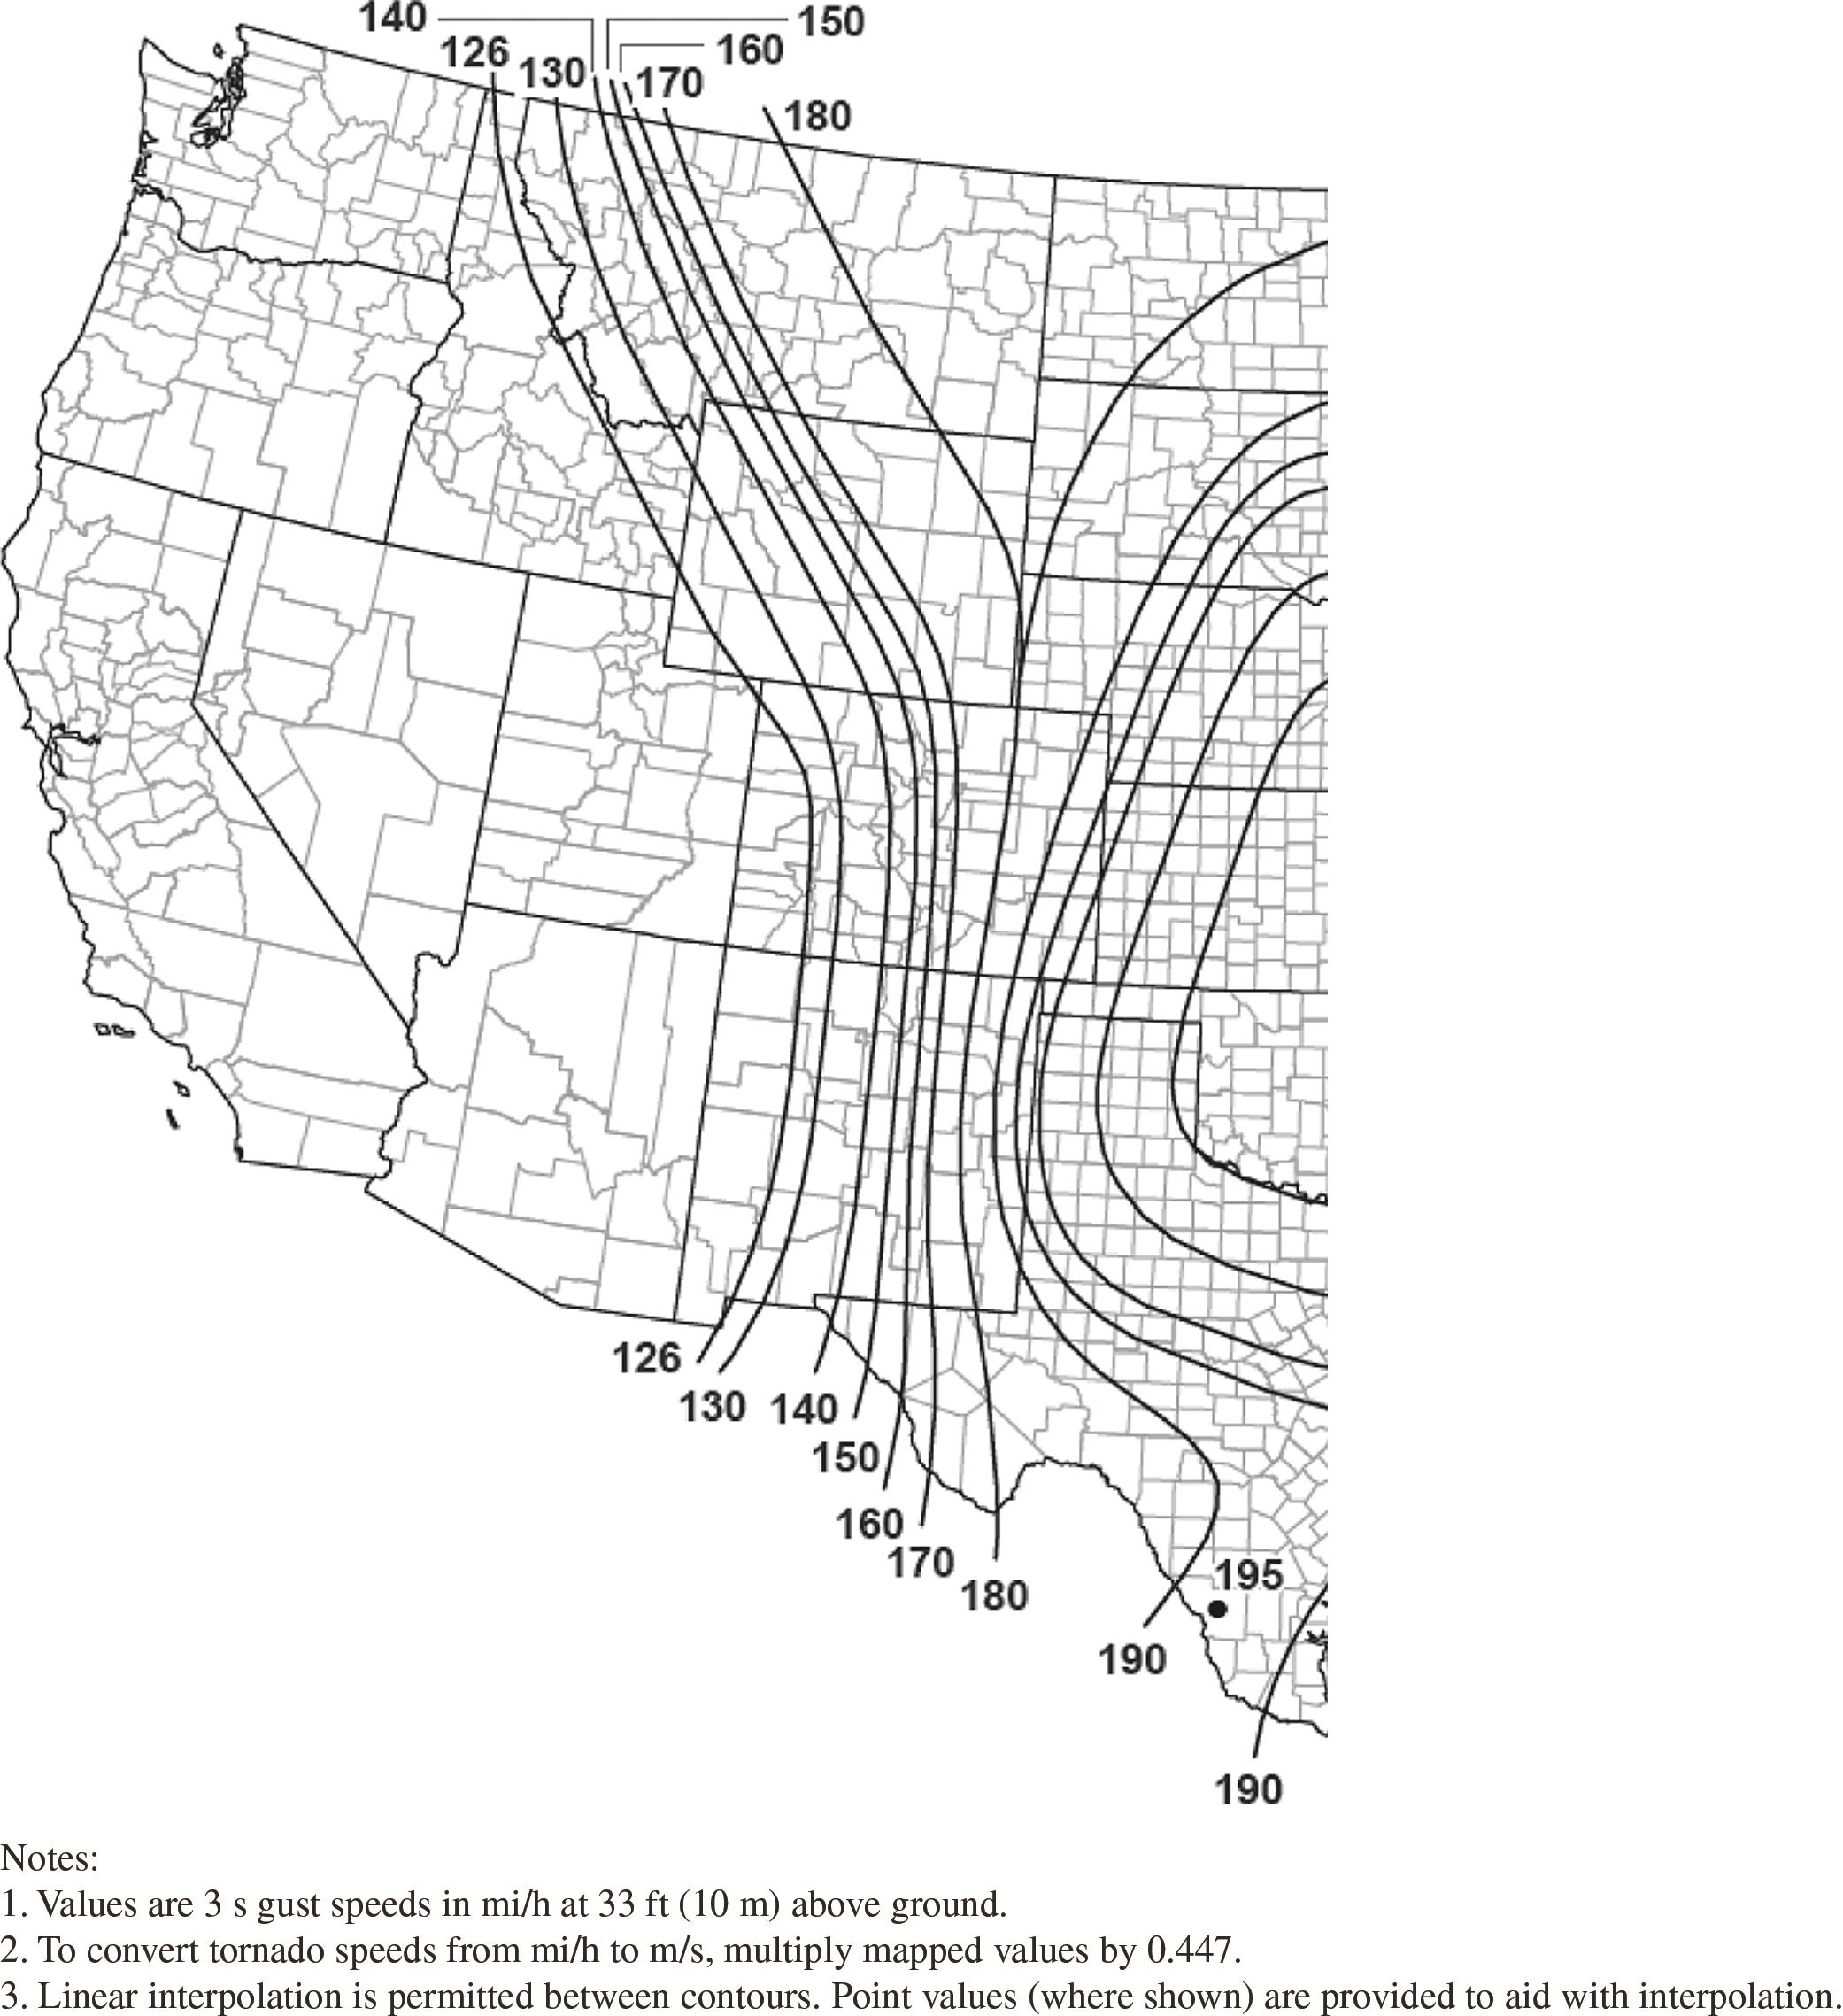
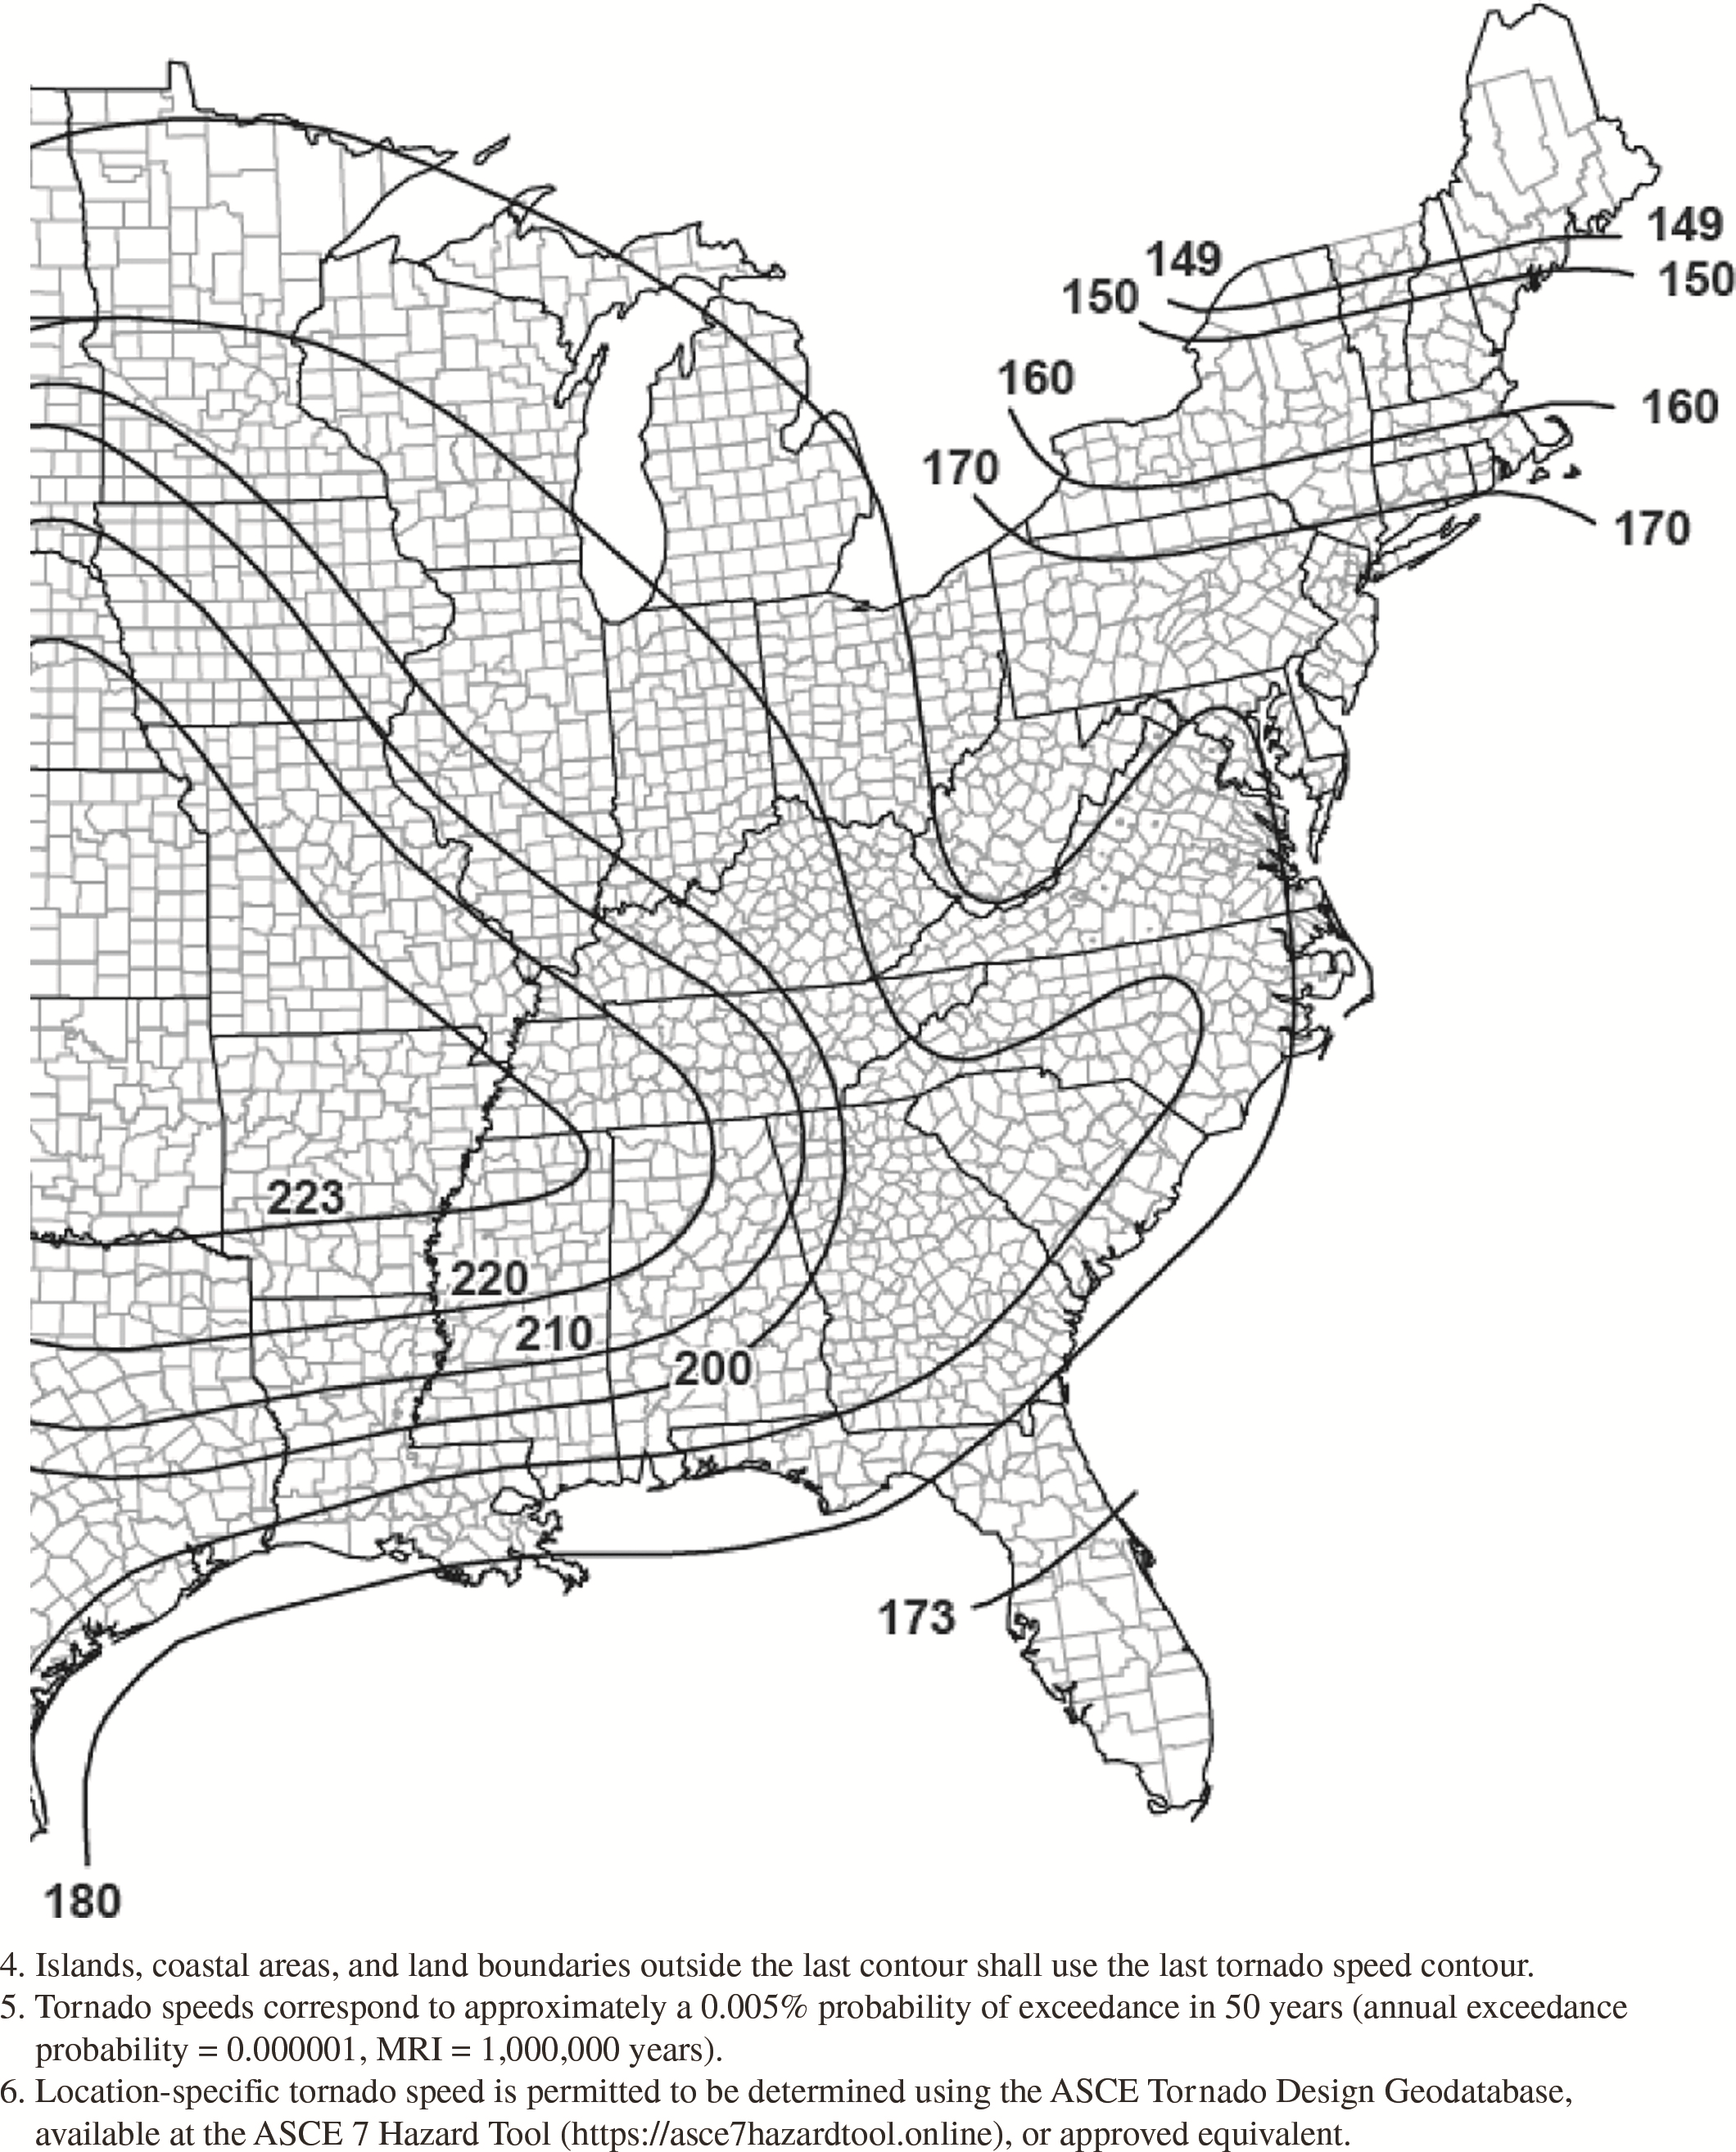
Figure G.2-3D. Tornado speeds for 1,000,000-year MRI for
effective plan area of 40,000
ft2
(3,716 m2).
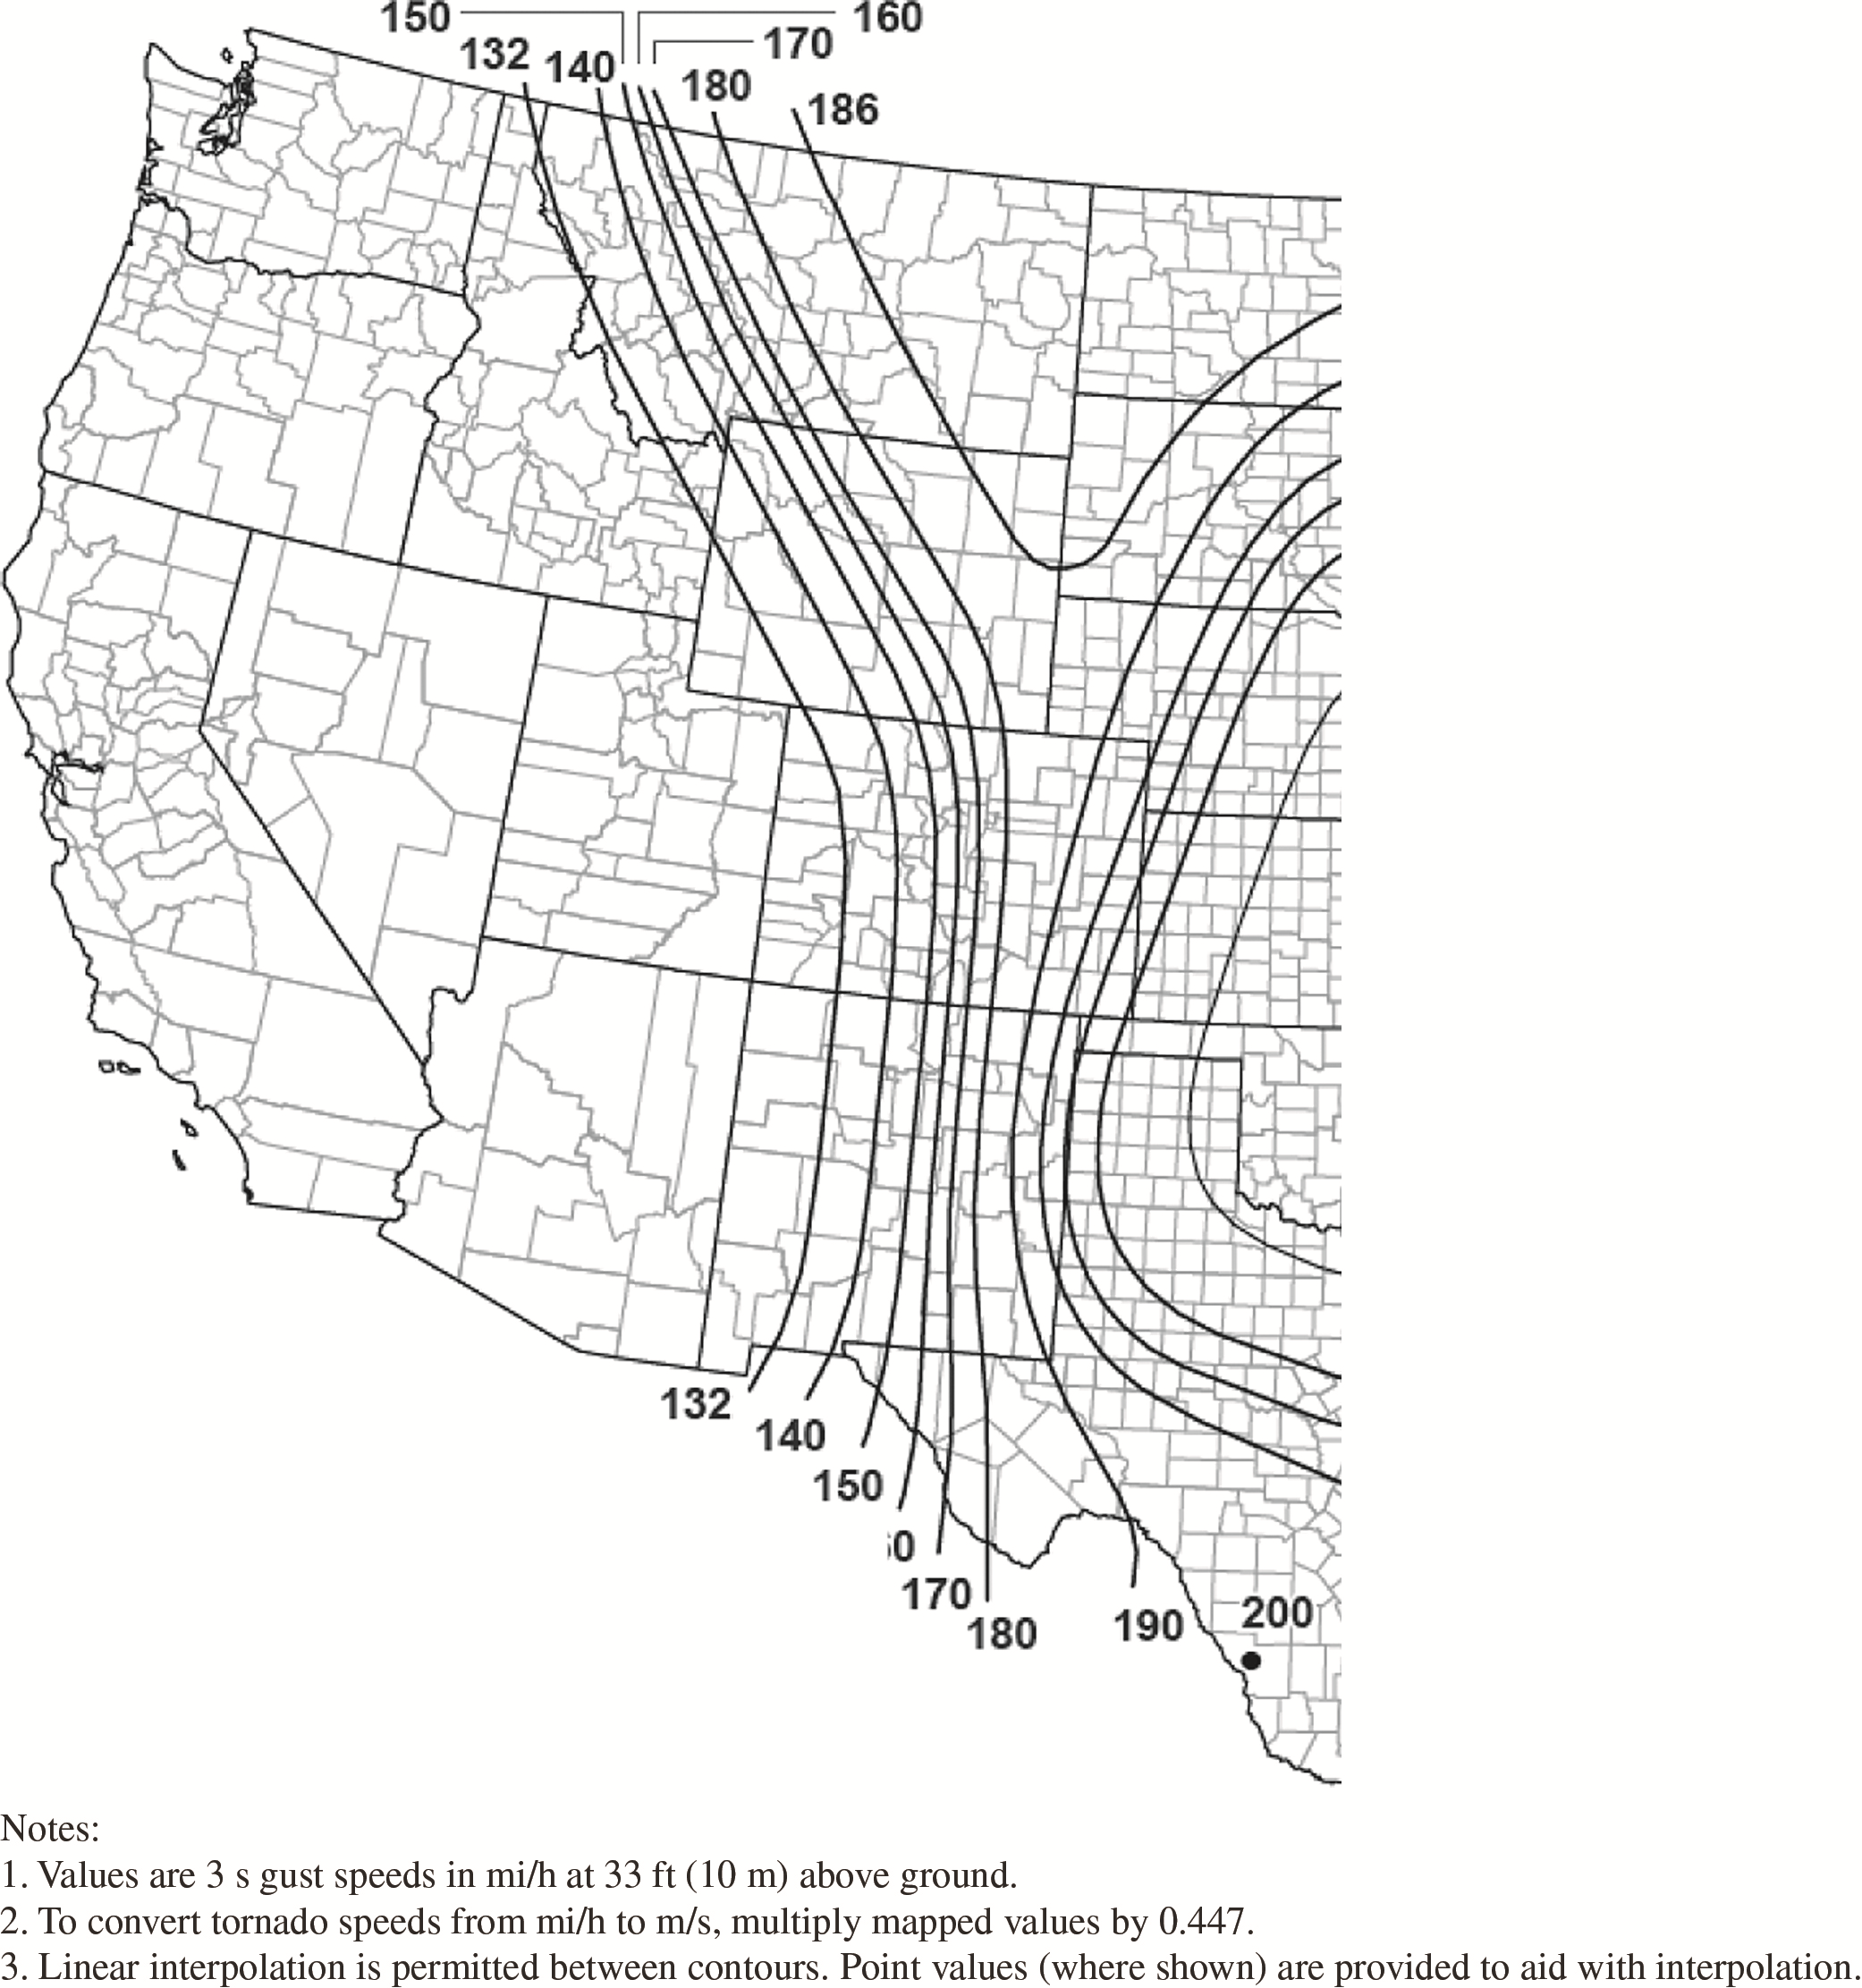
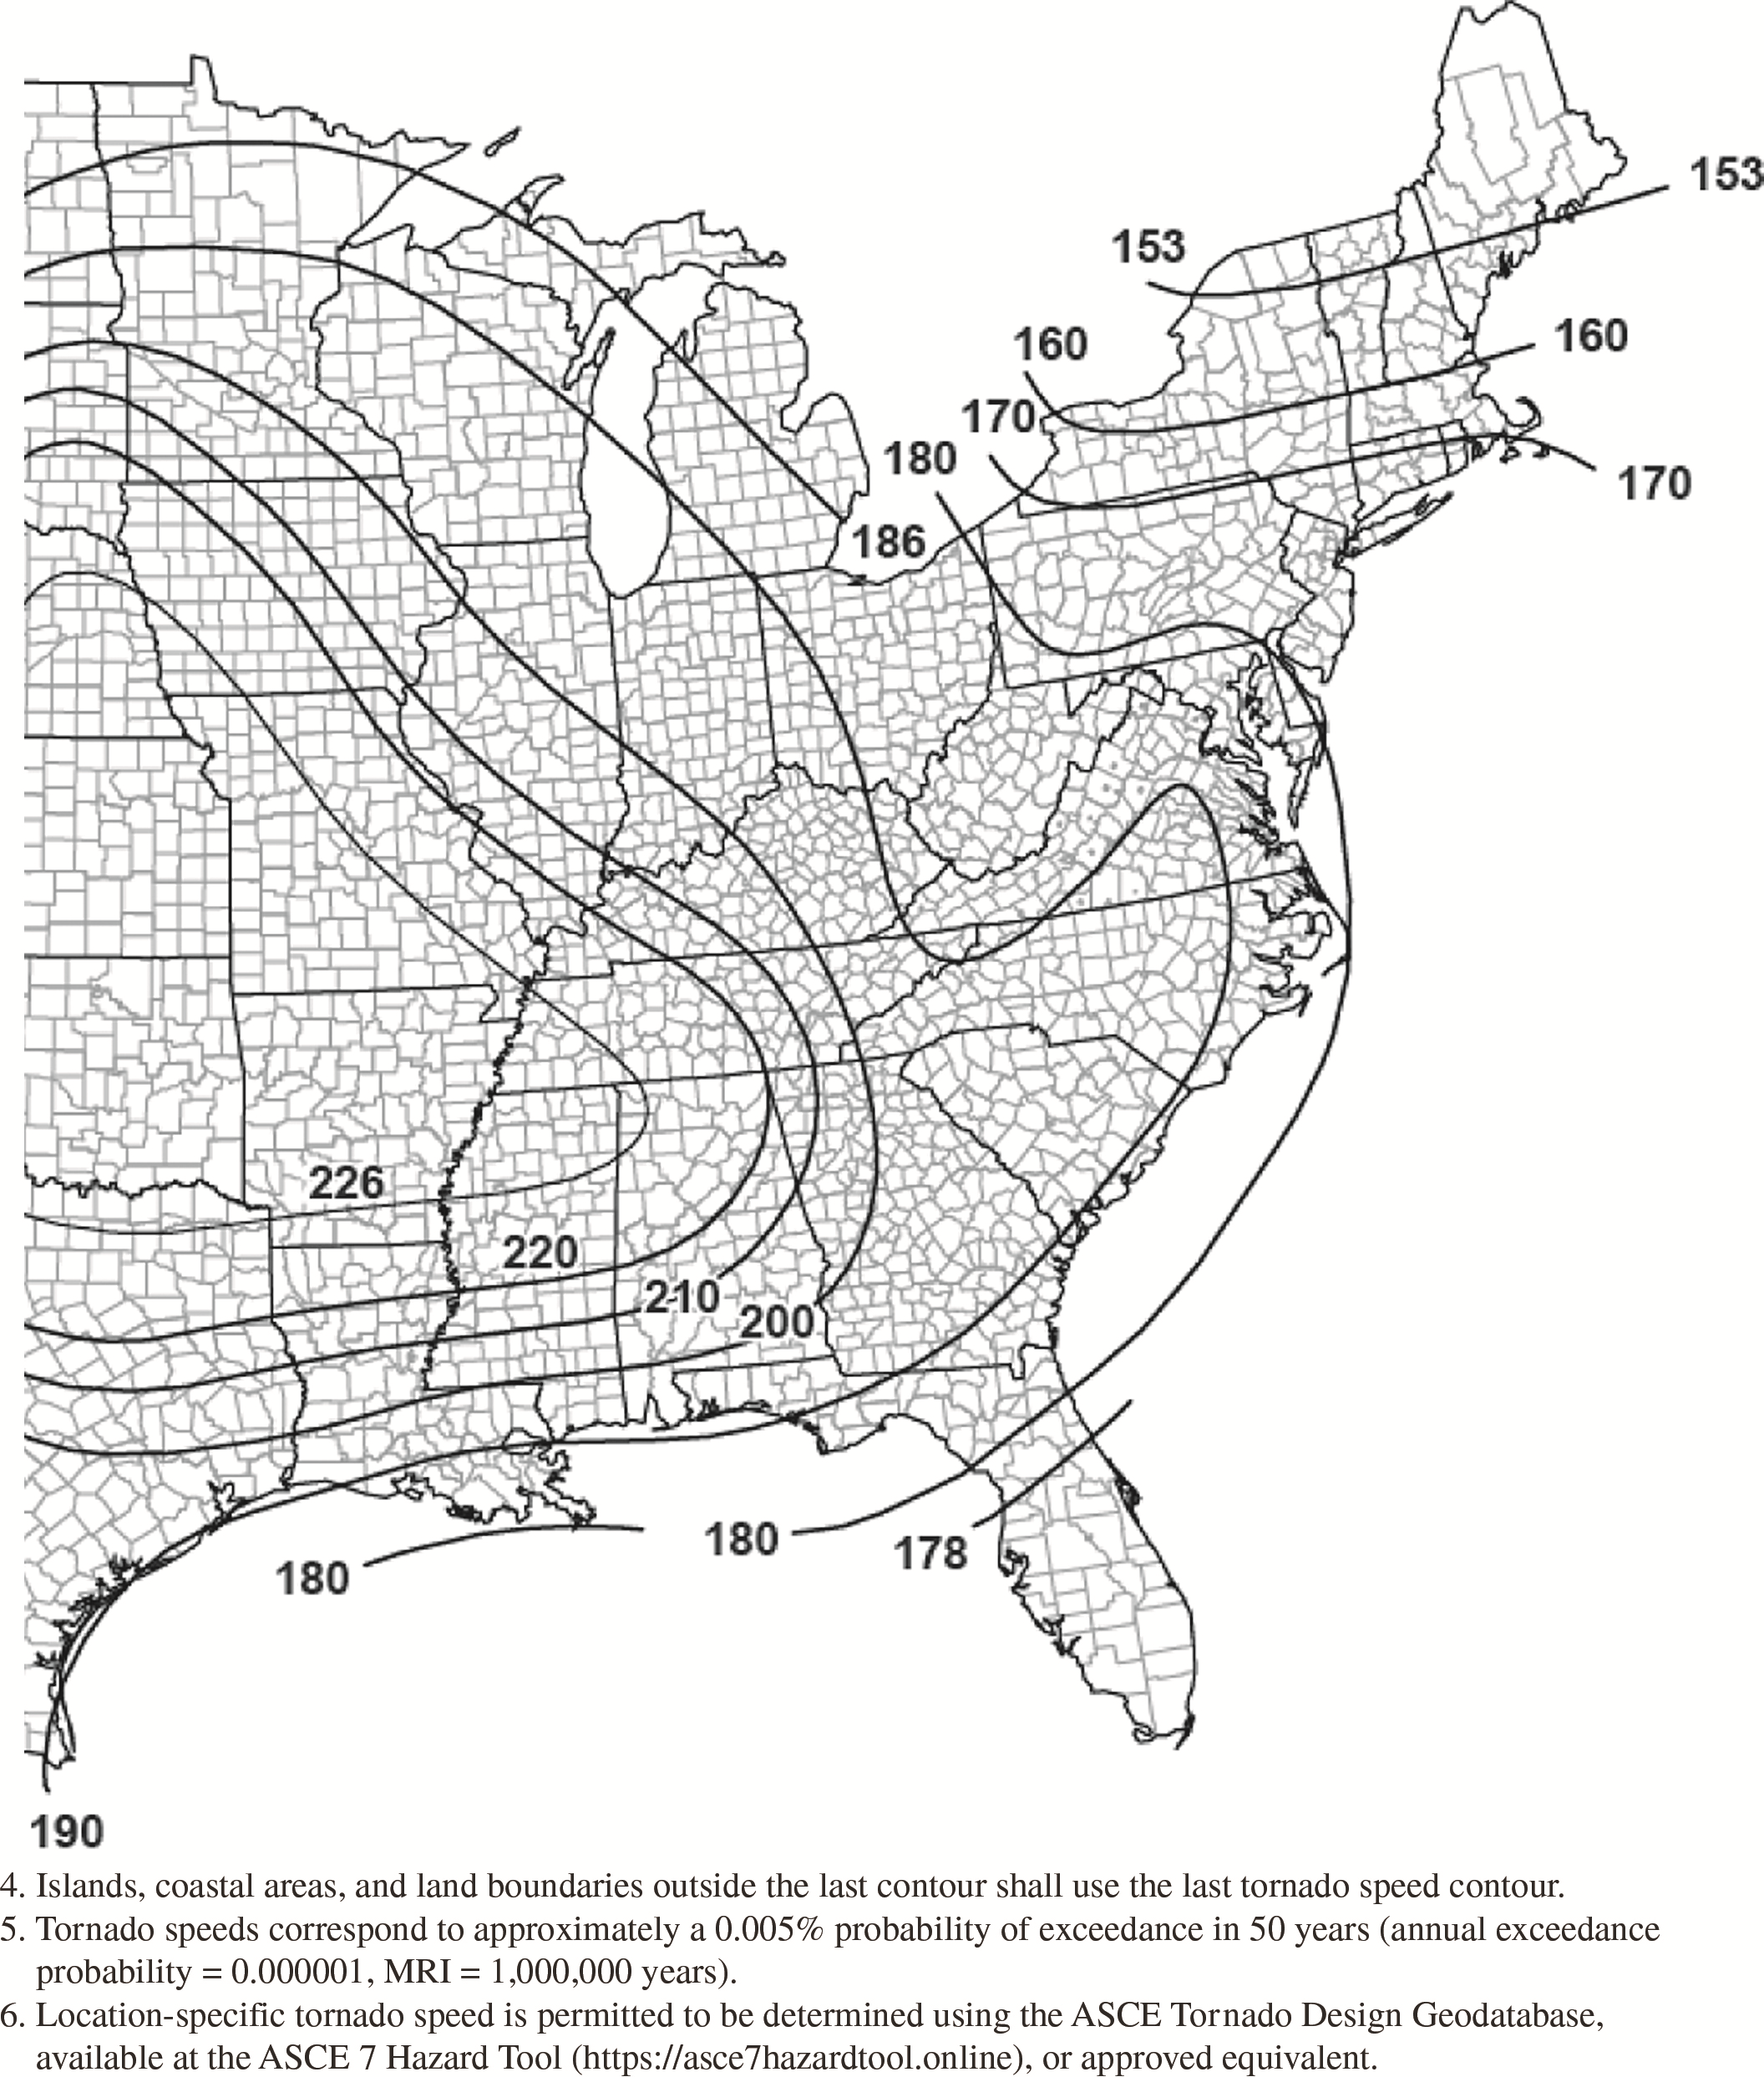
Figure G.2-3E. Tornado speeds for 1,000,000-year MRI for
effective plan area of 100,000
ft2
(9,290 m2).
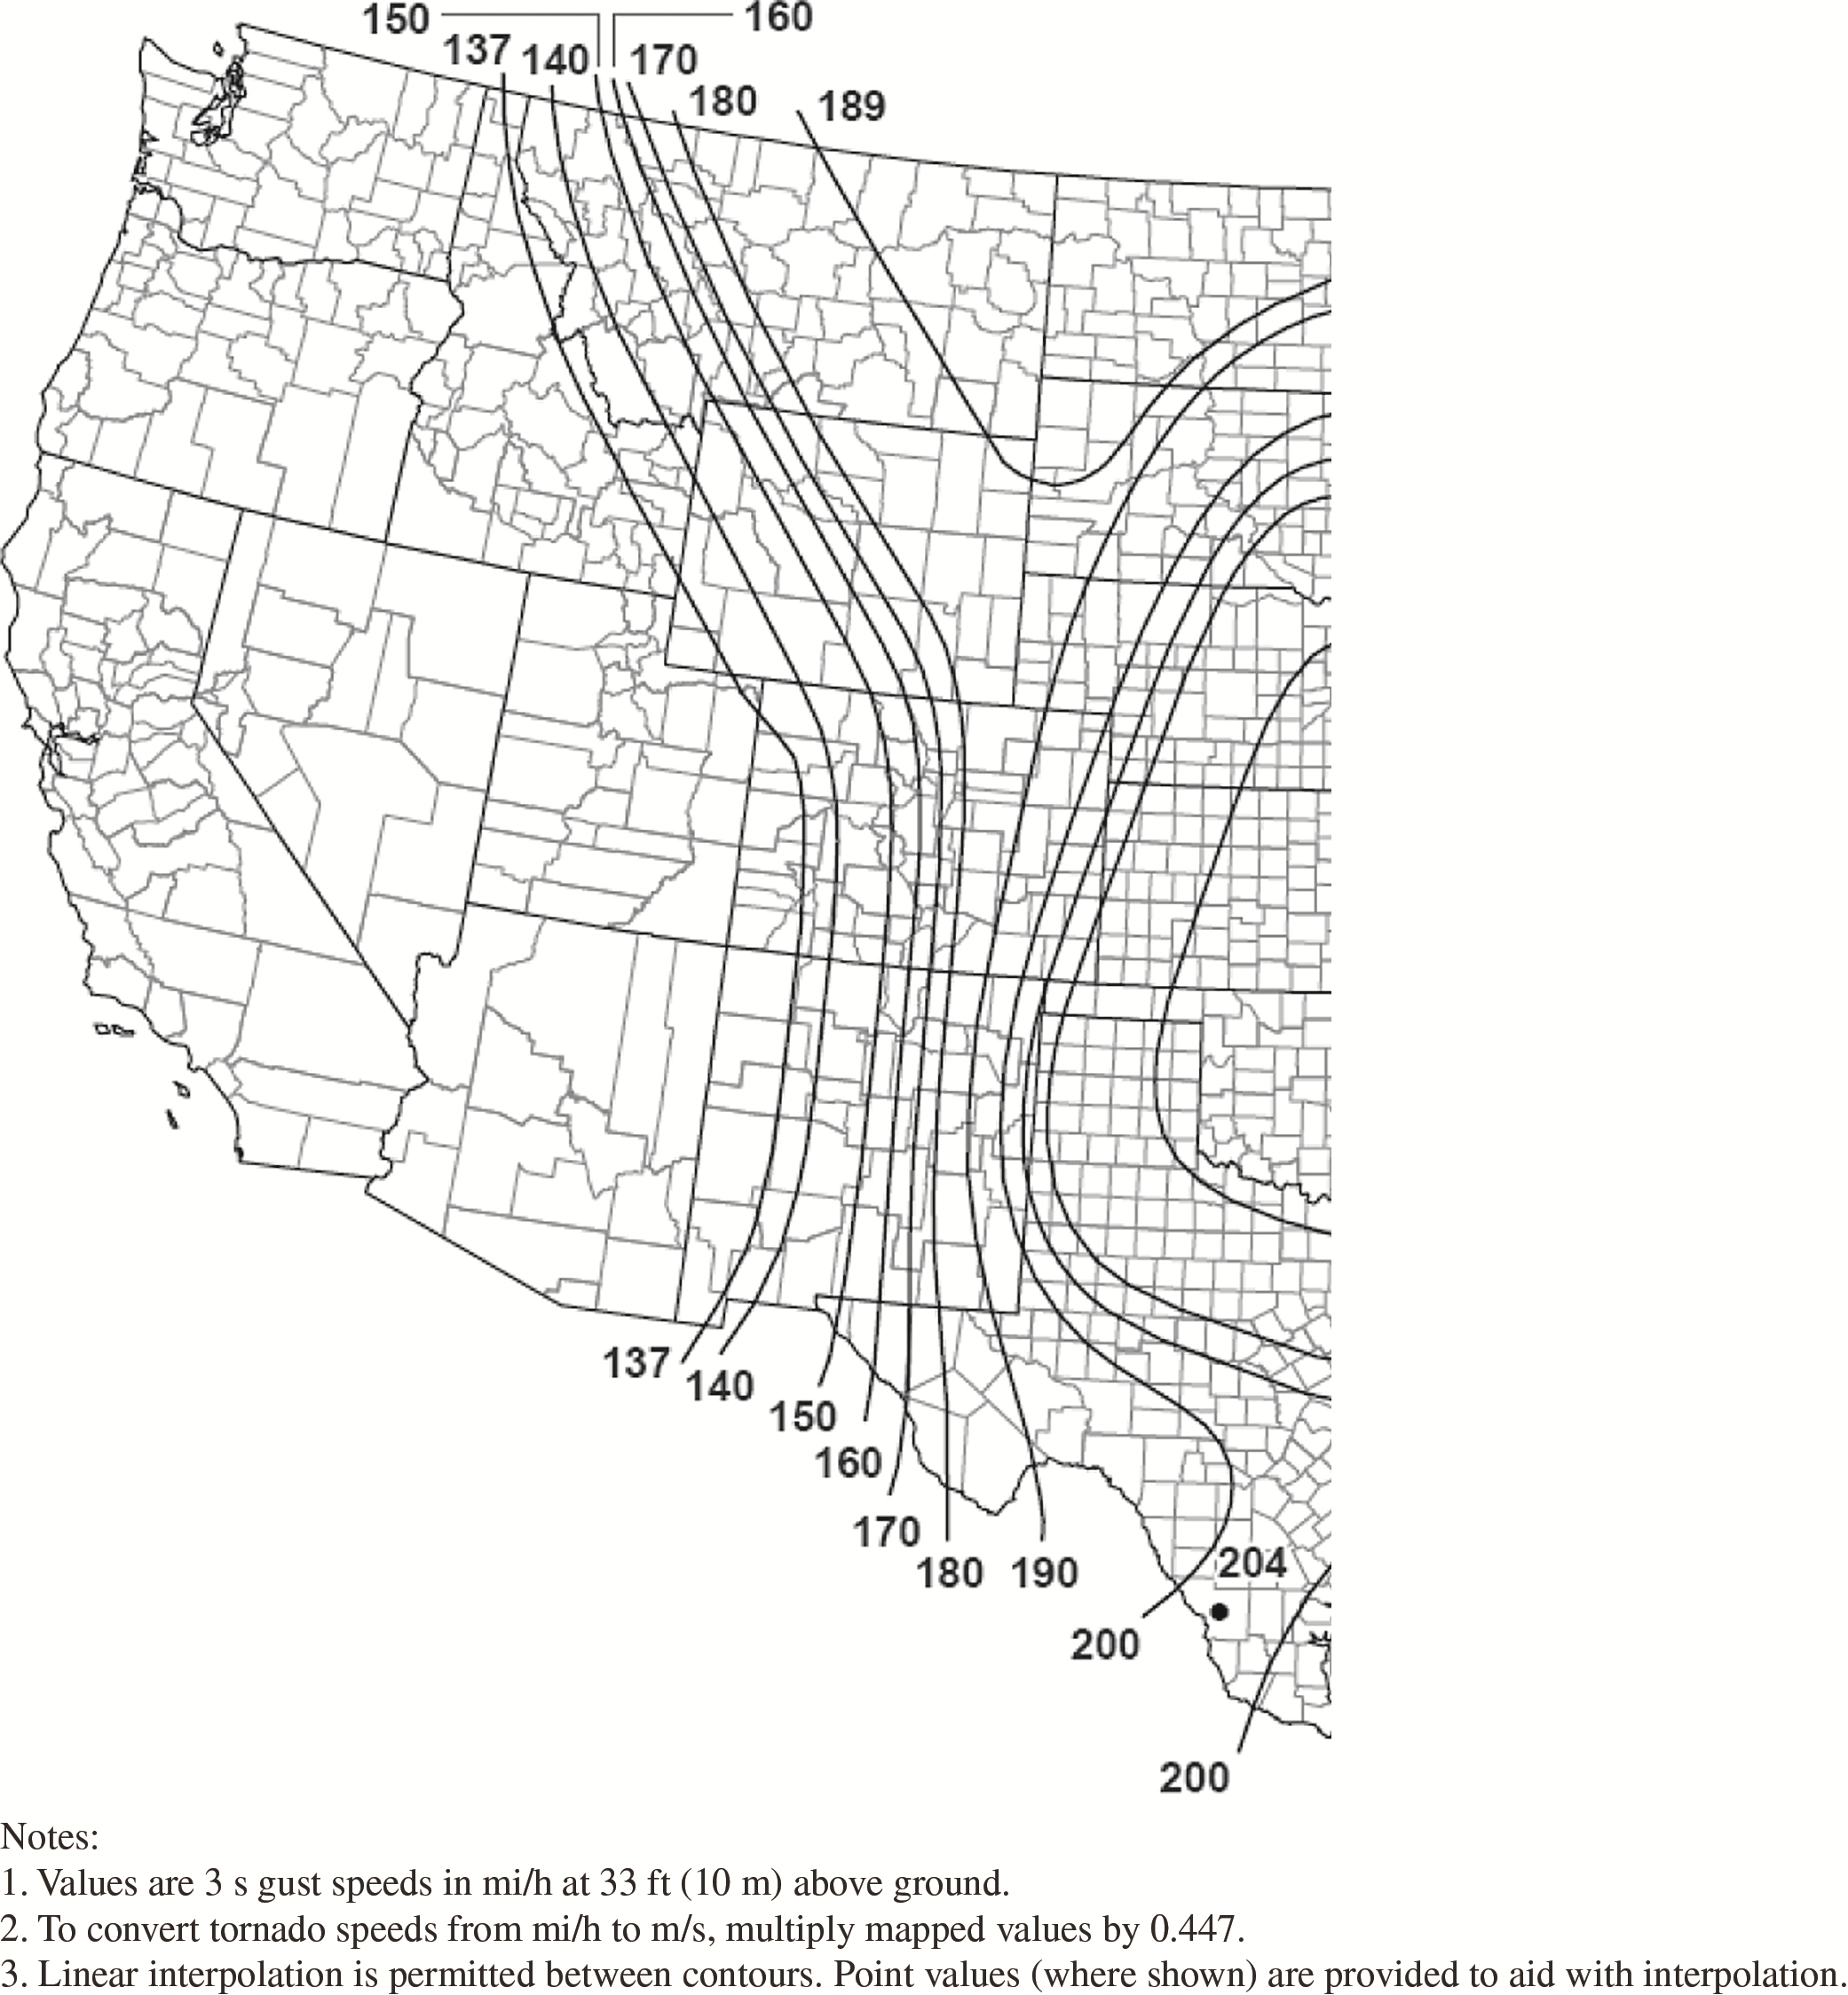
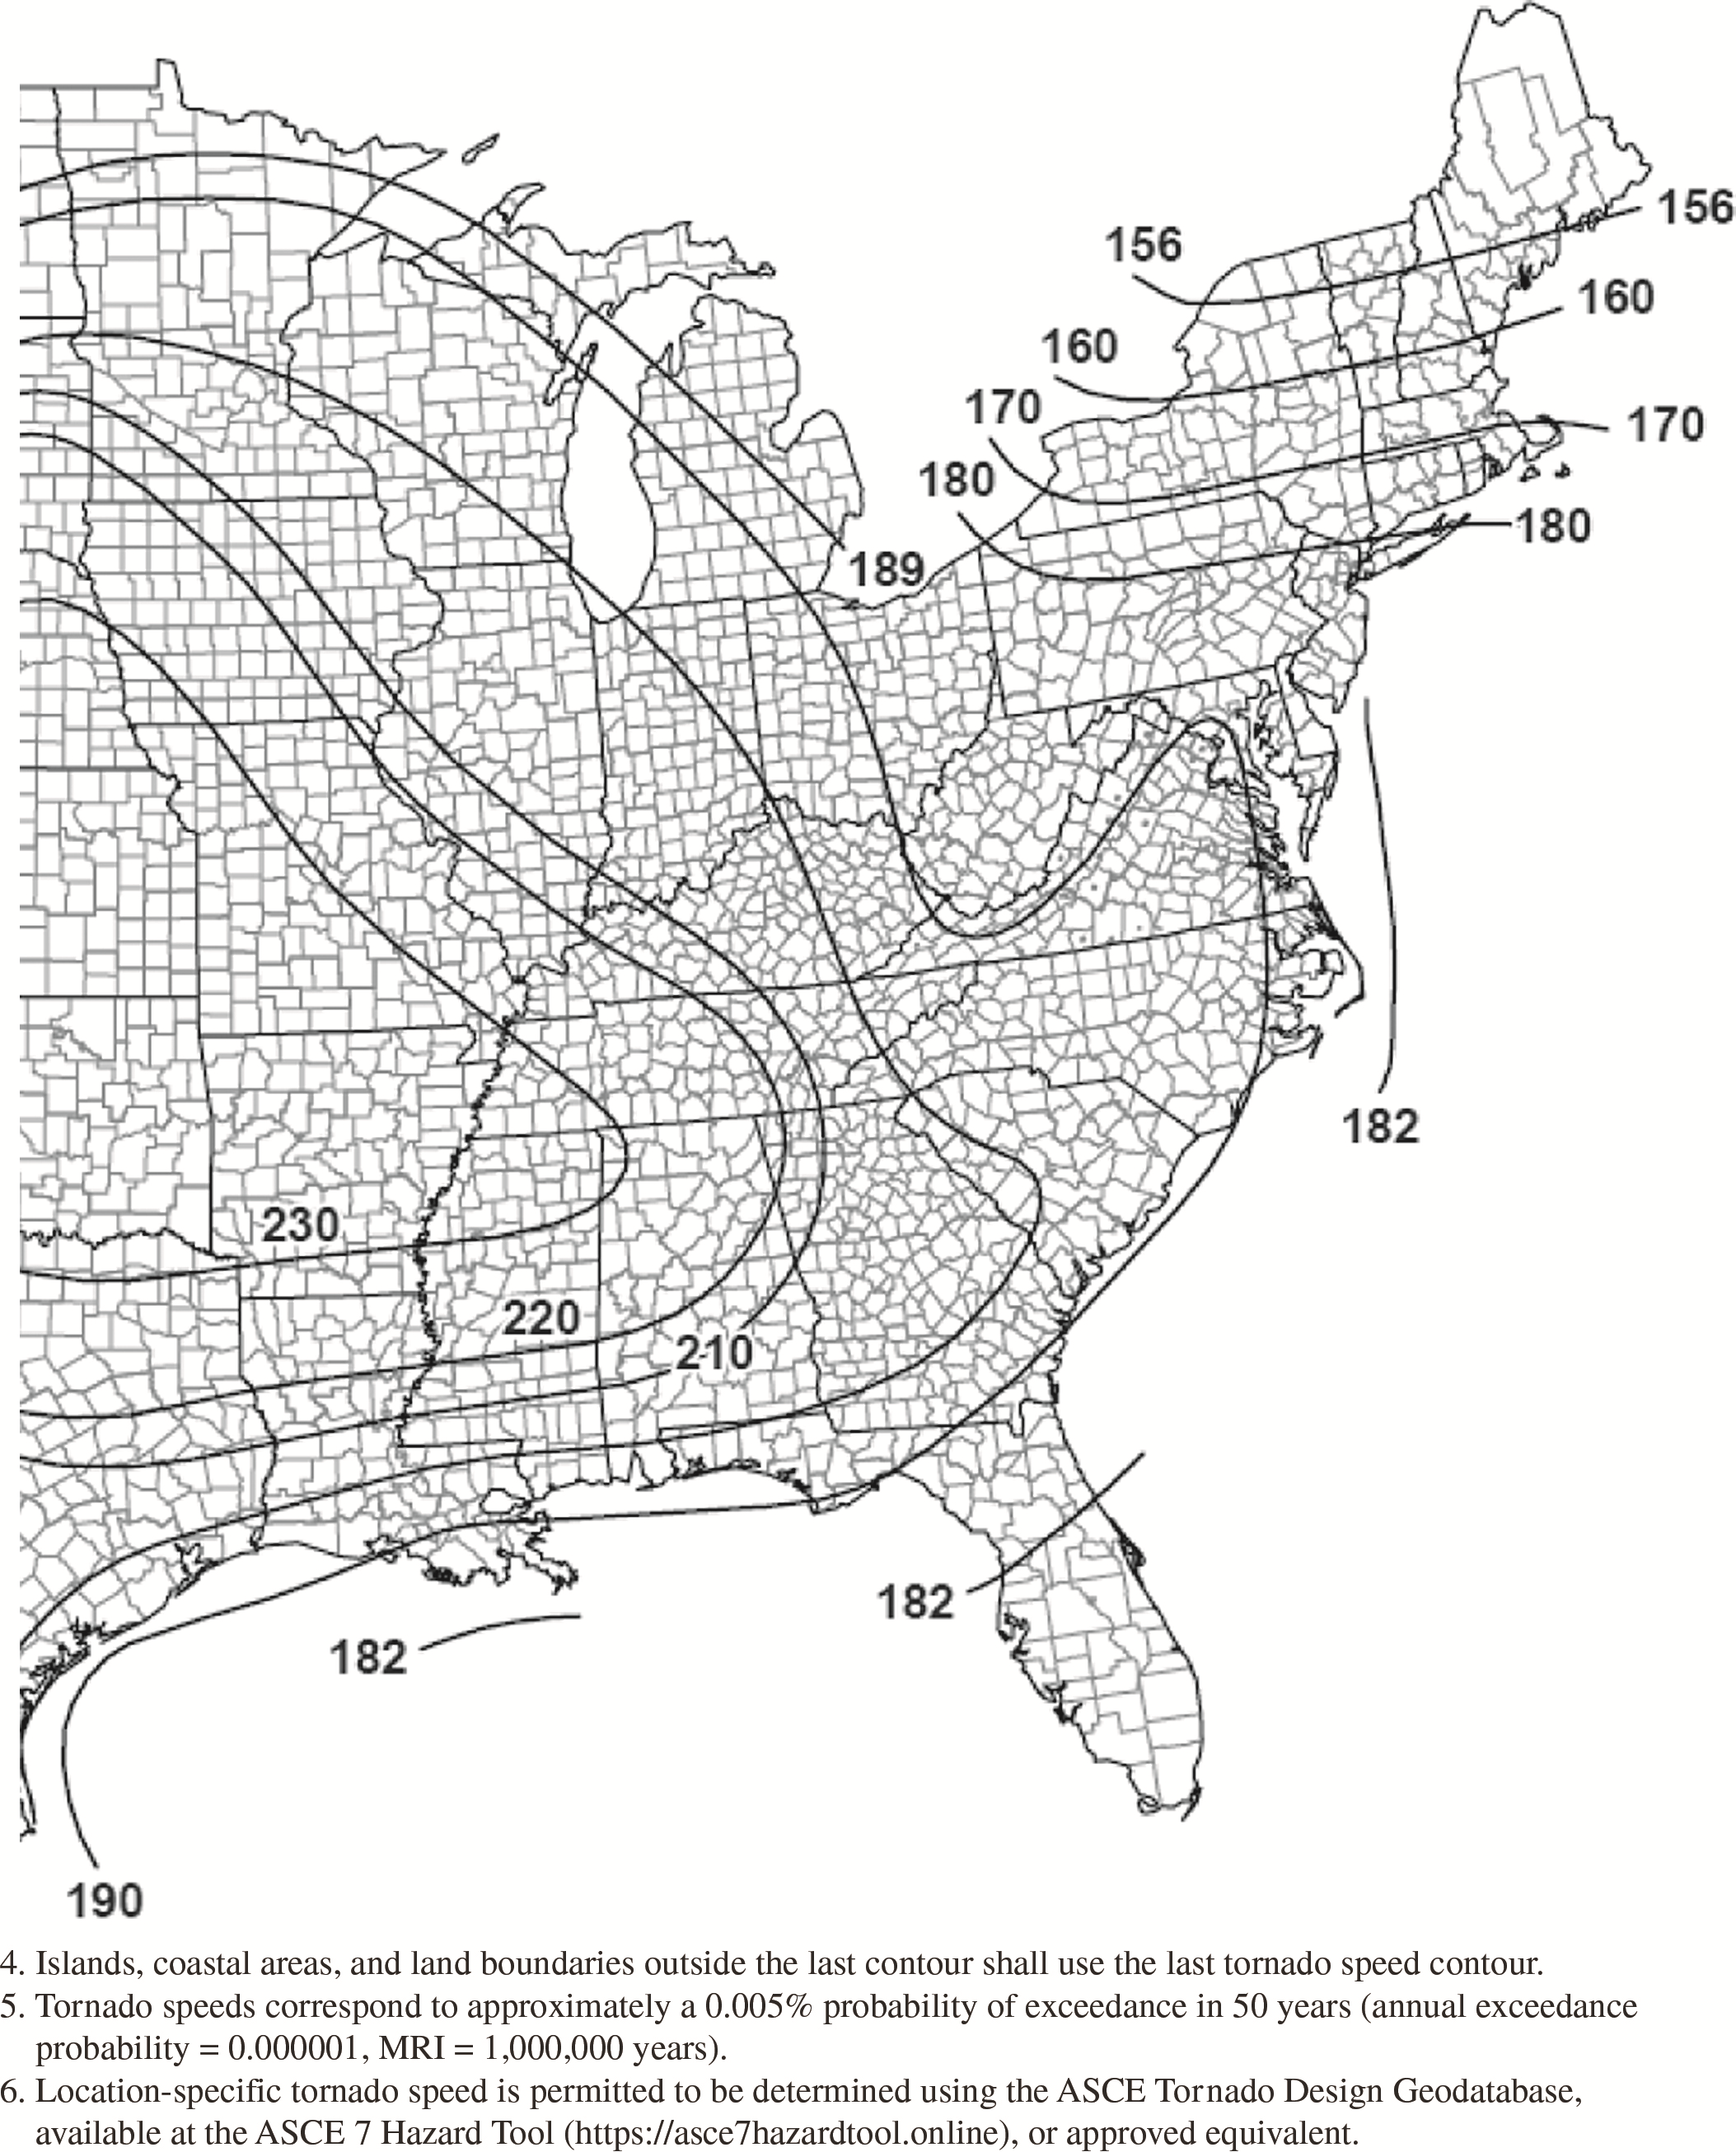
Figure G.2-3F. Tornado speeds for 1,000,000-year MRI for
effective plan area of 250,000
ft2
(23,226
m2).
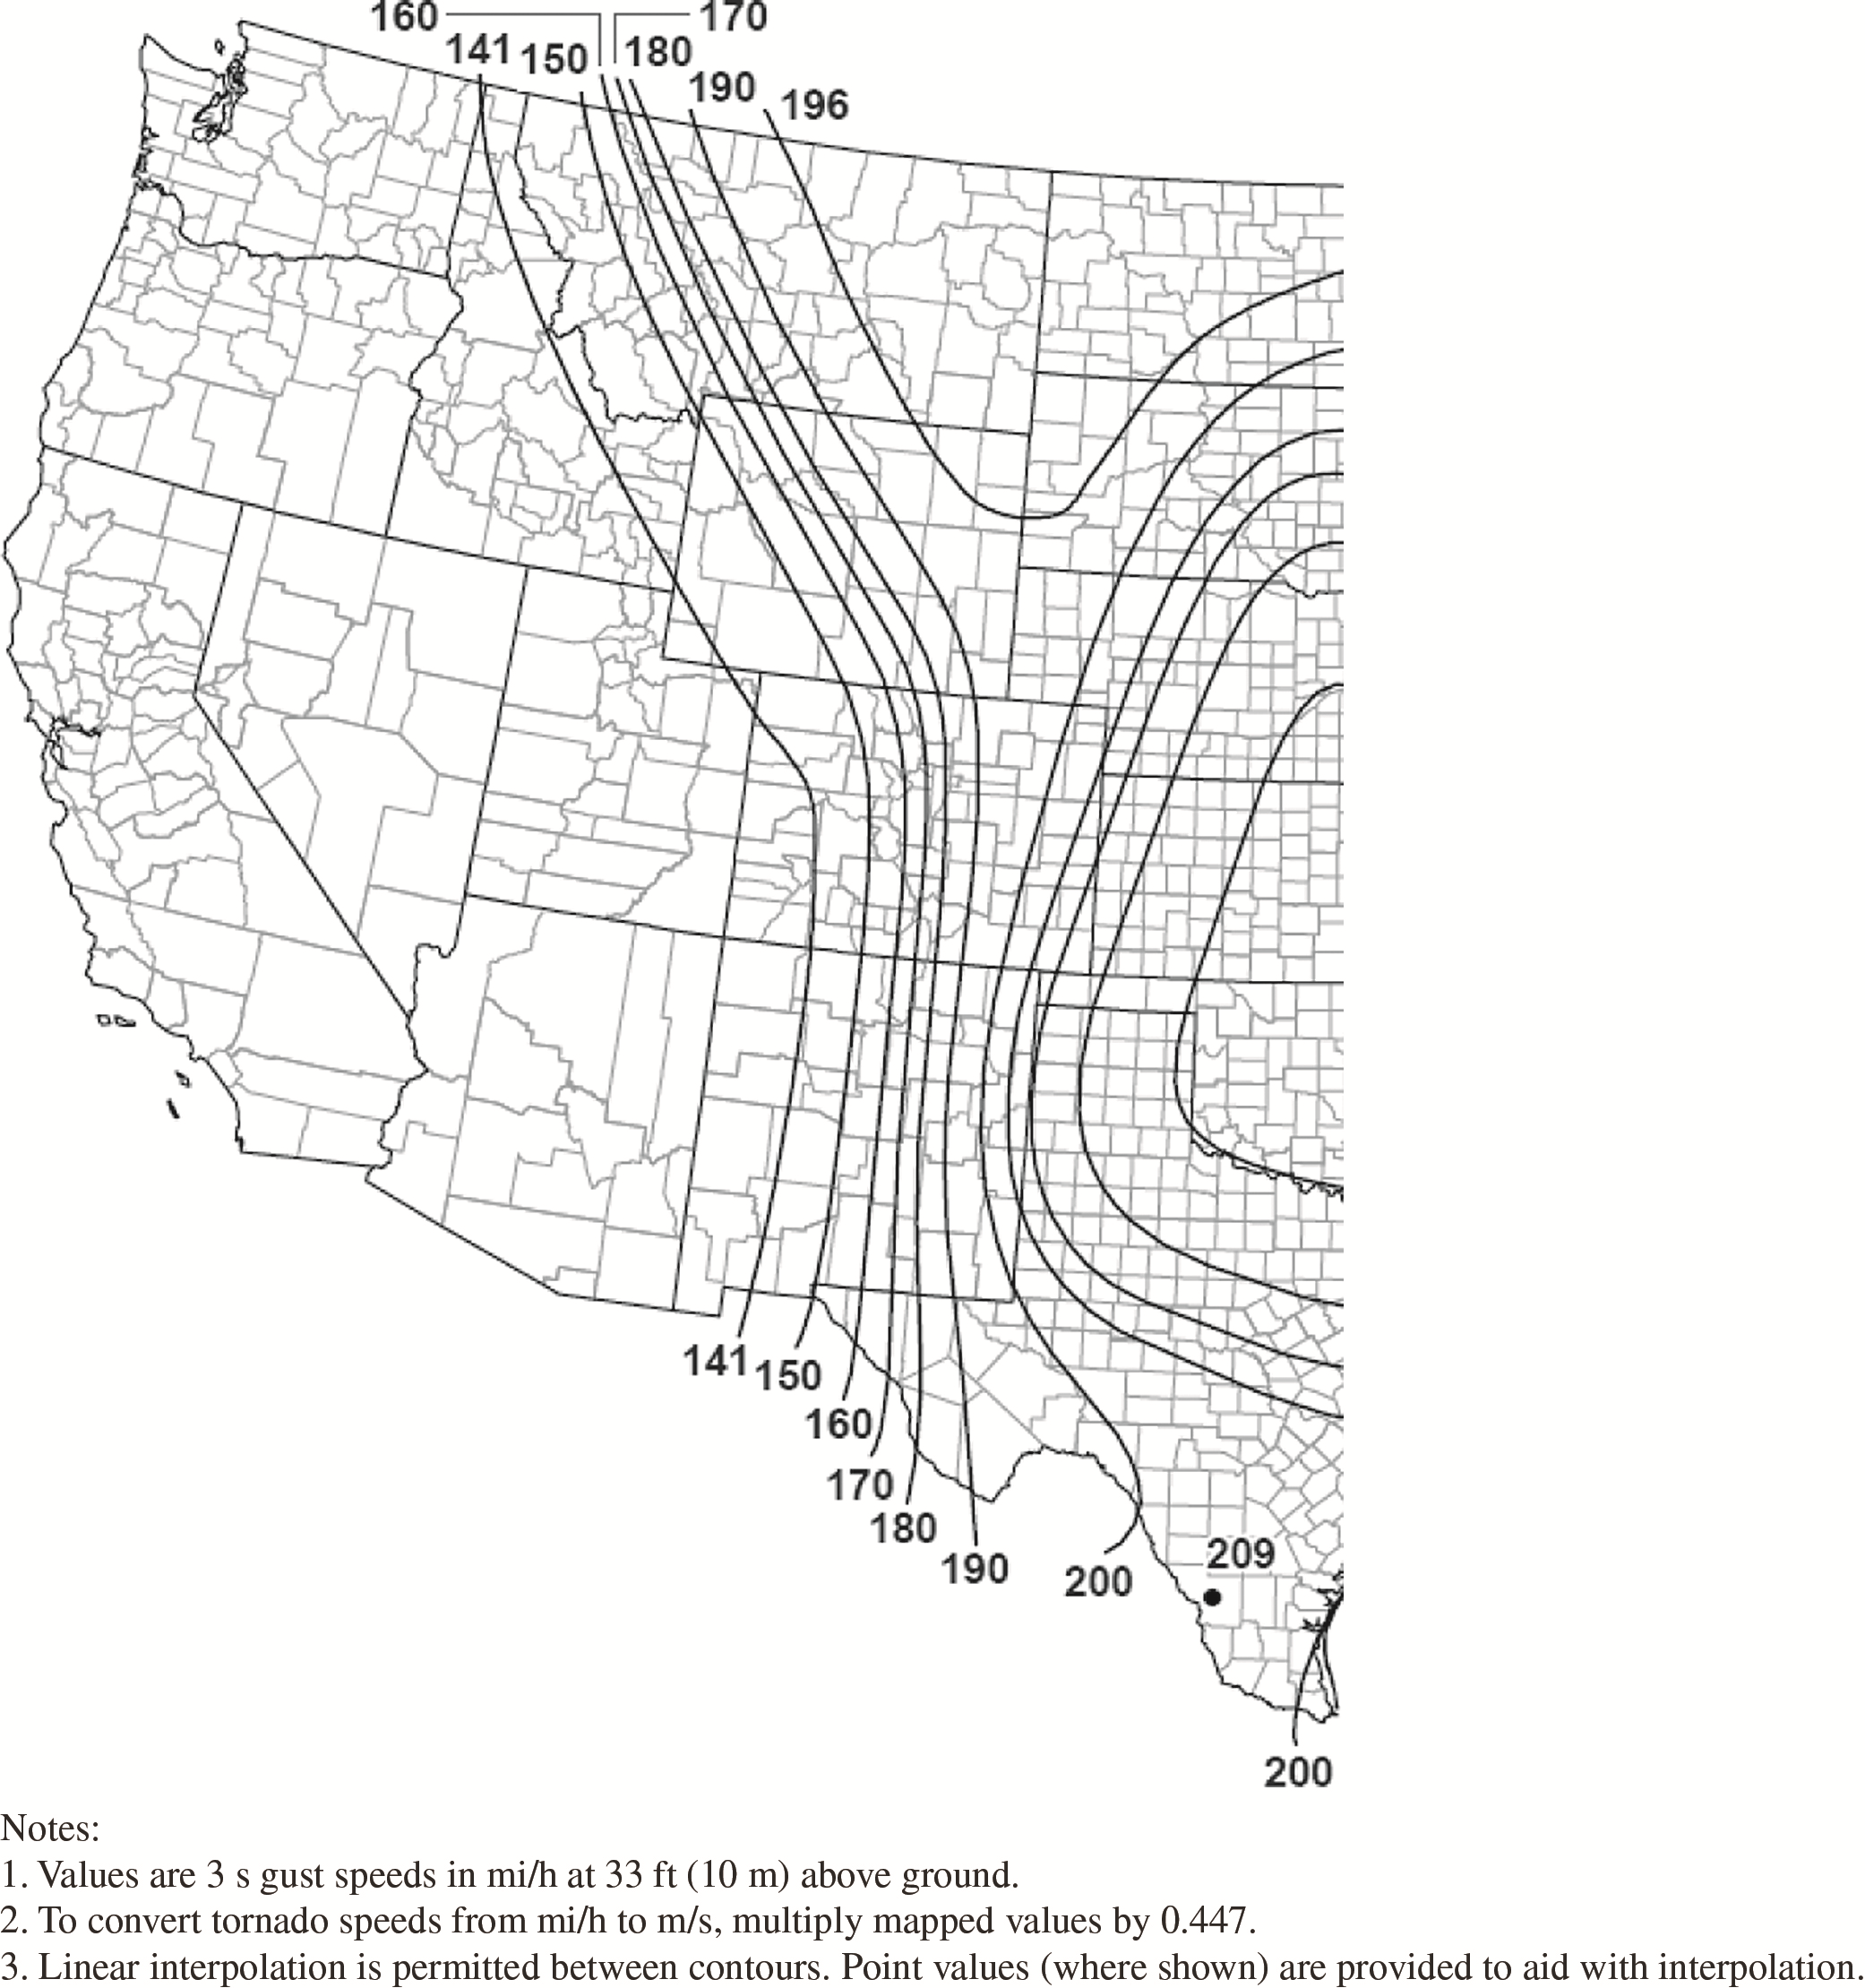
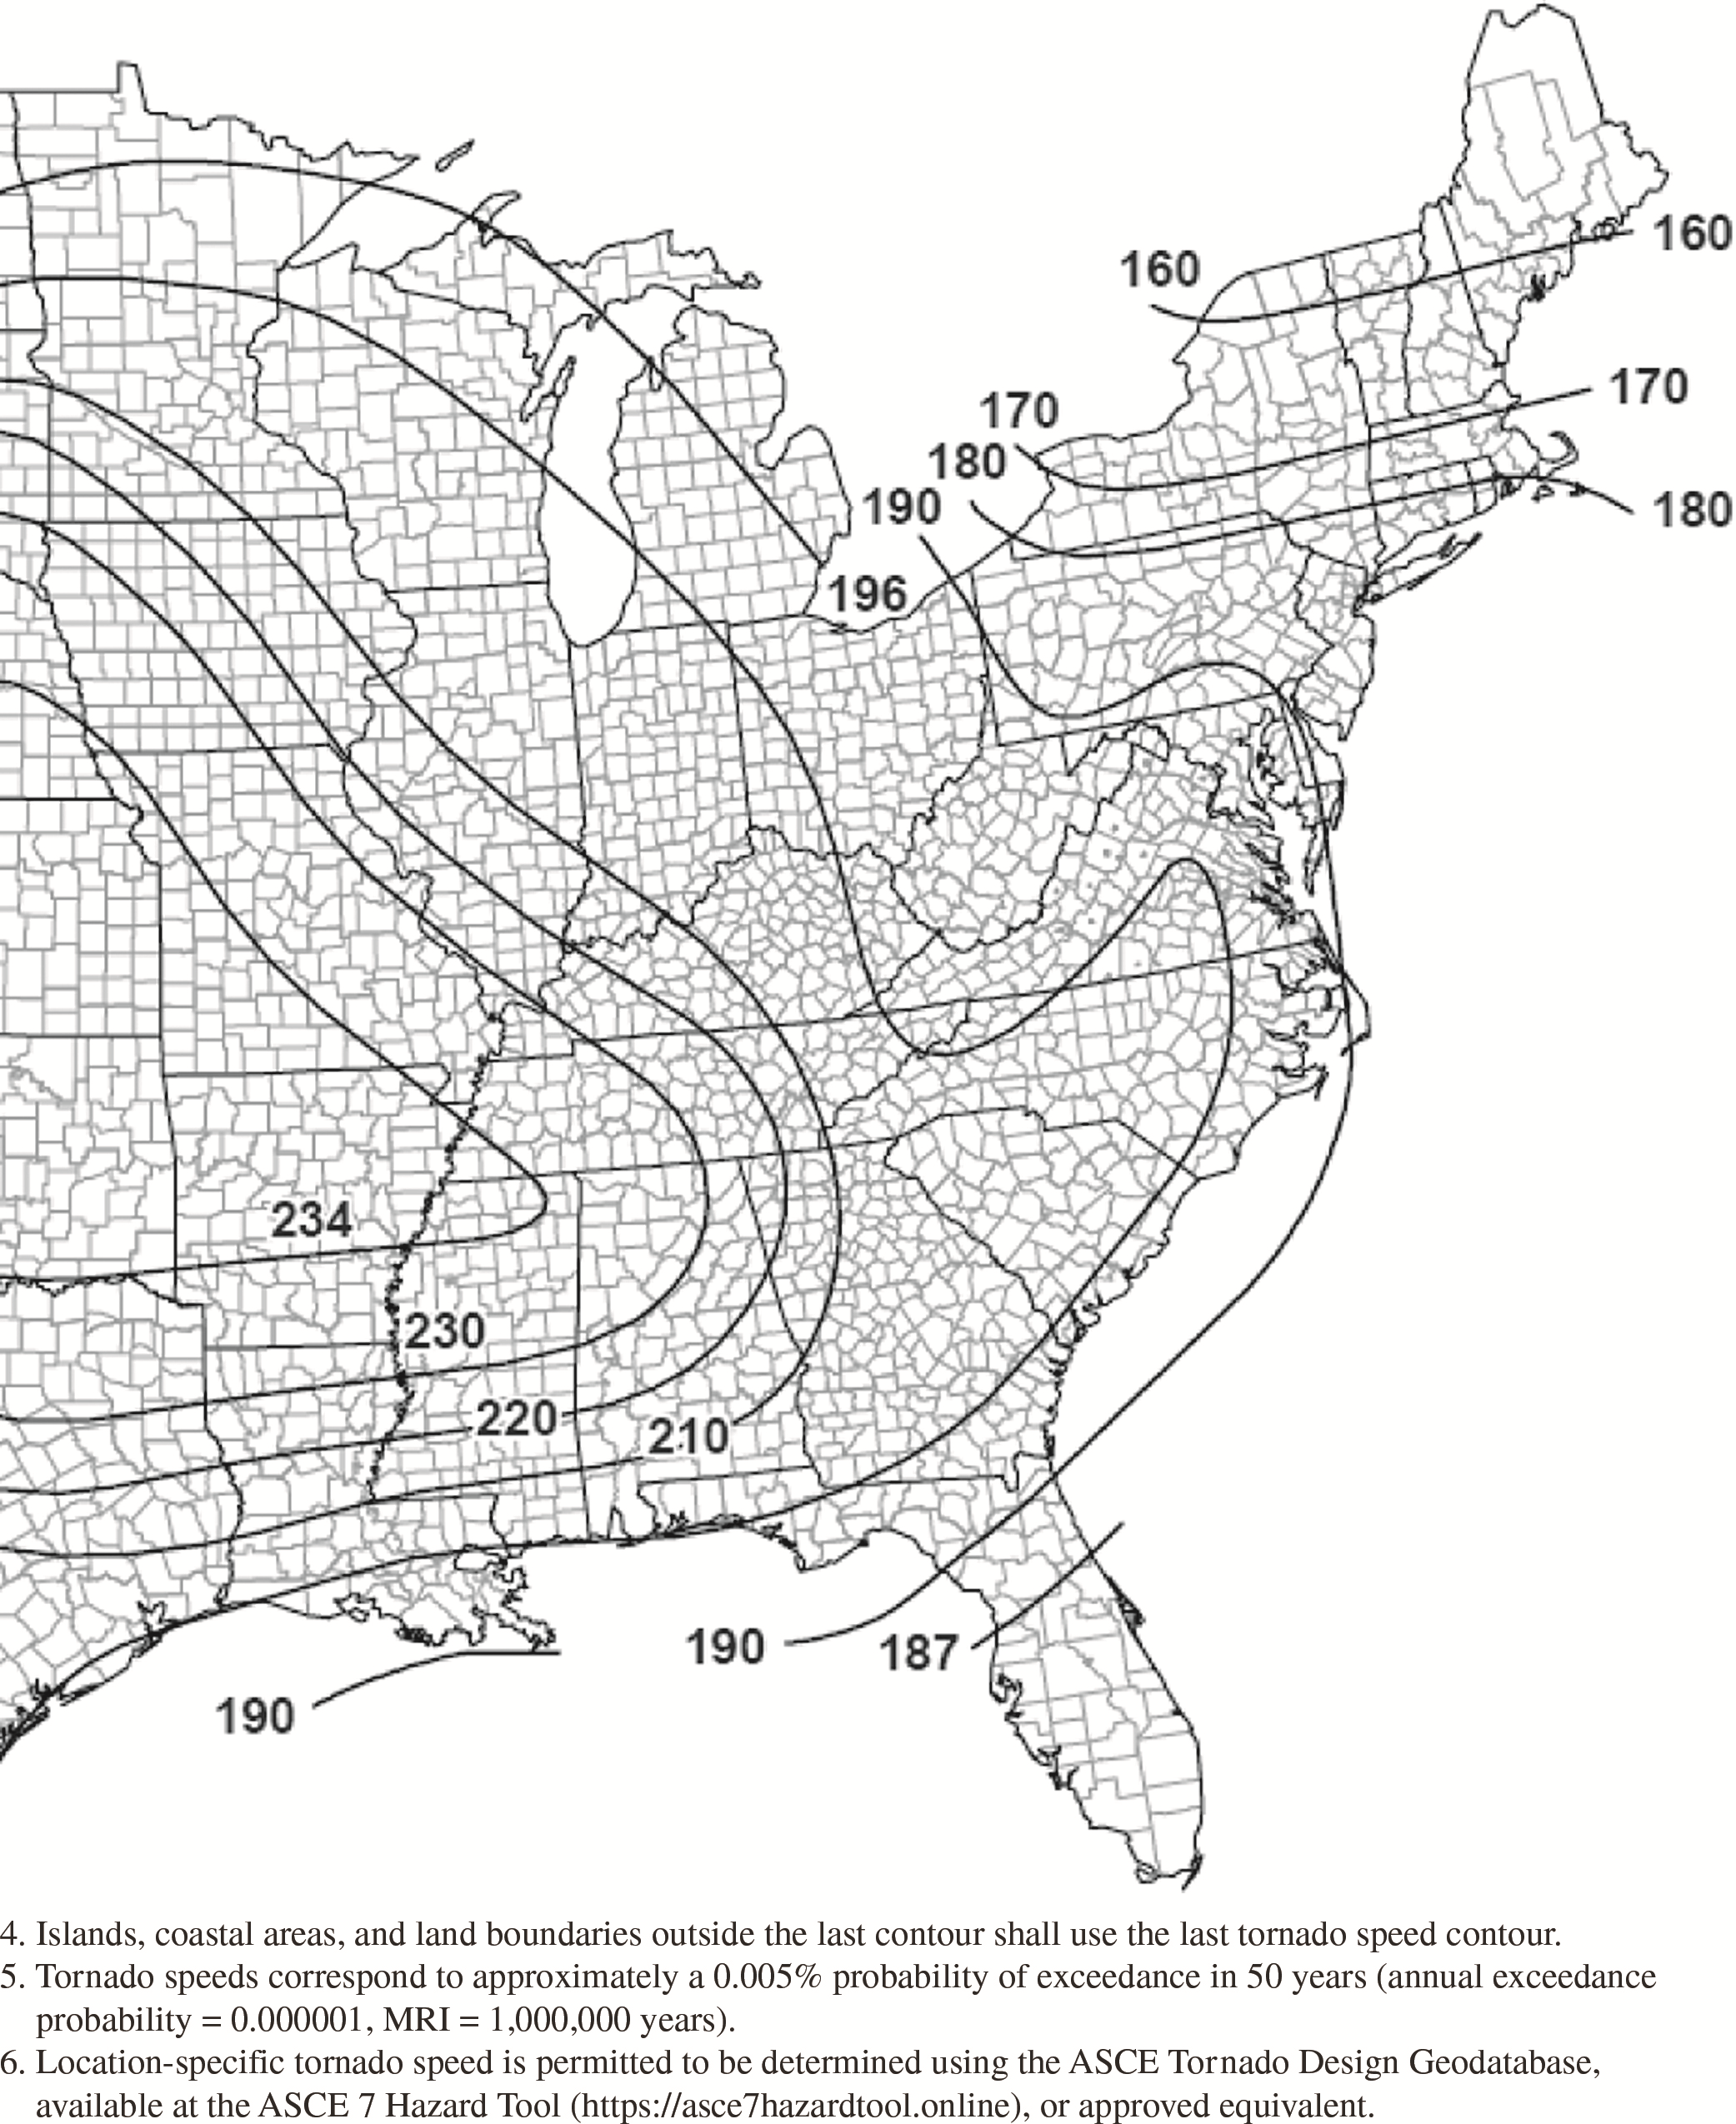
Figure G.2-3G. Tornado speeds for 1,000,000-year MRI for
effective plan area of 1,000,000
ft2
(92,903
m2).
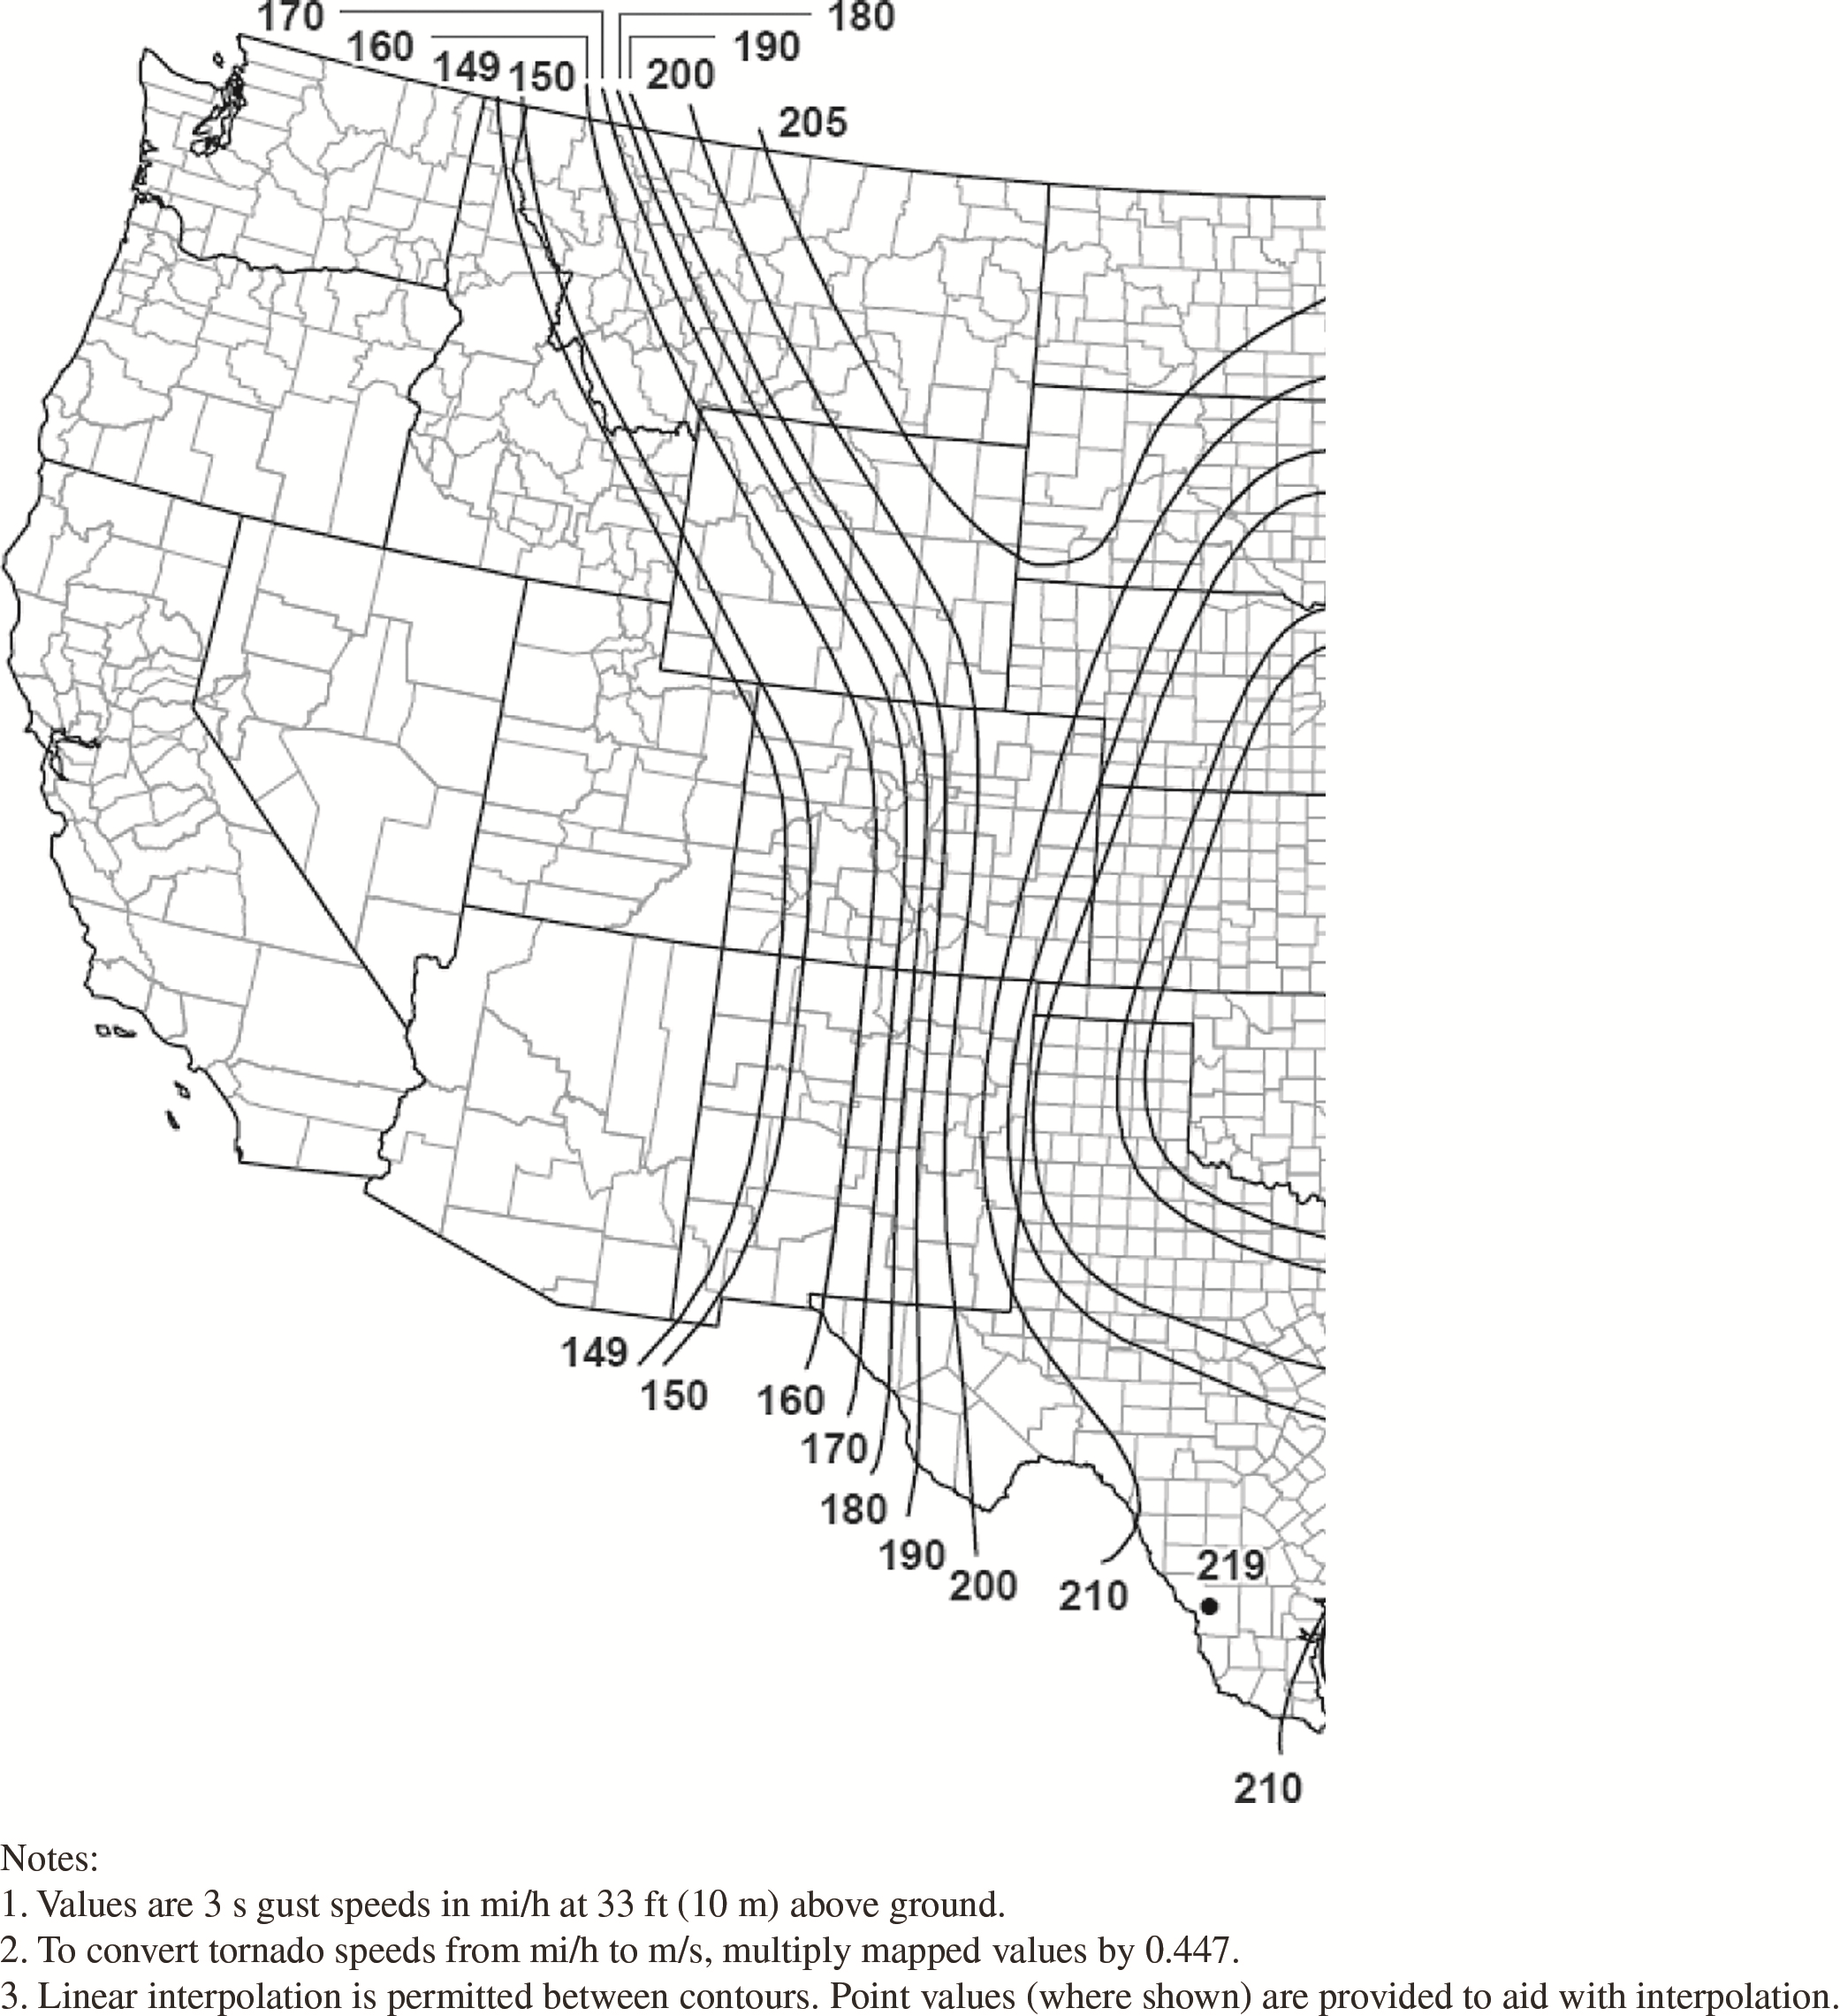
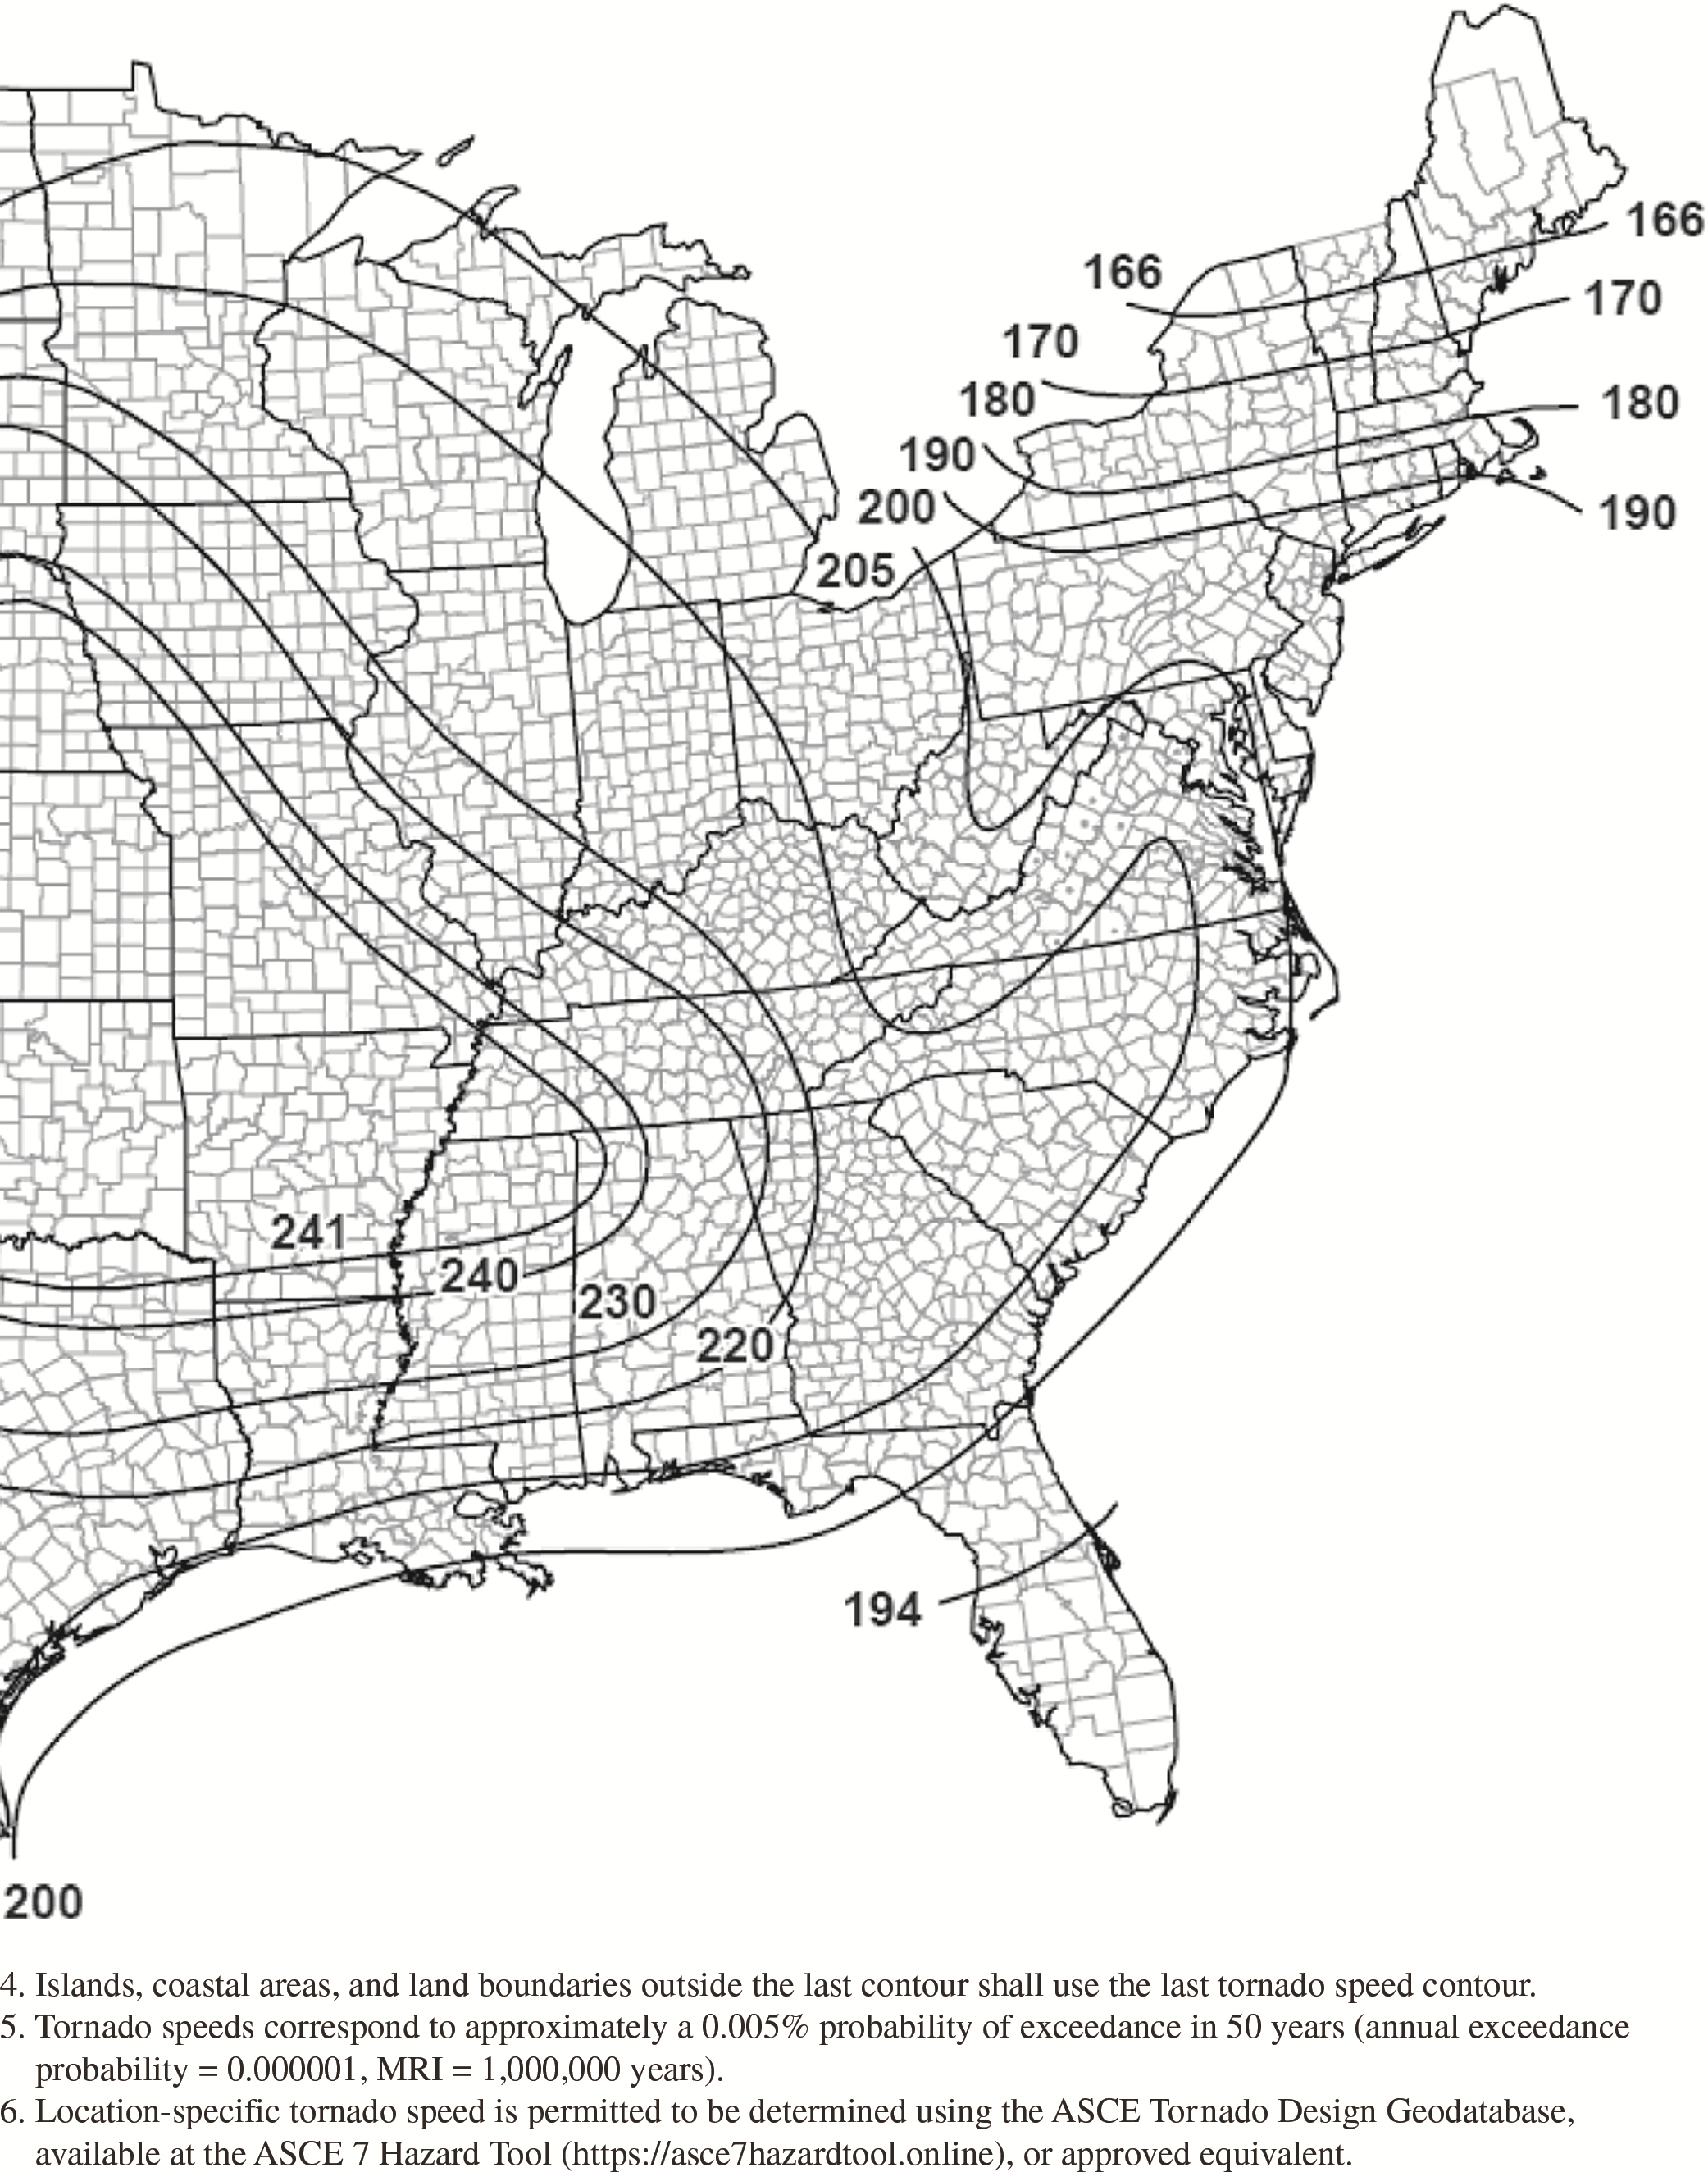
Figure G.2-3H. Tornado speeds for 1,000,000-year MRI for
effective plan area of 4,000,000
ft2
(371,612
m2).
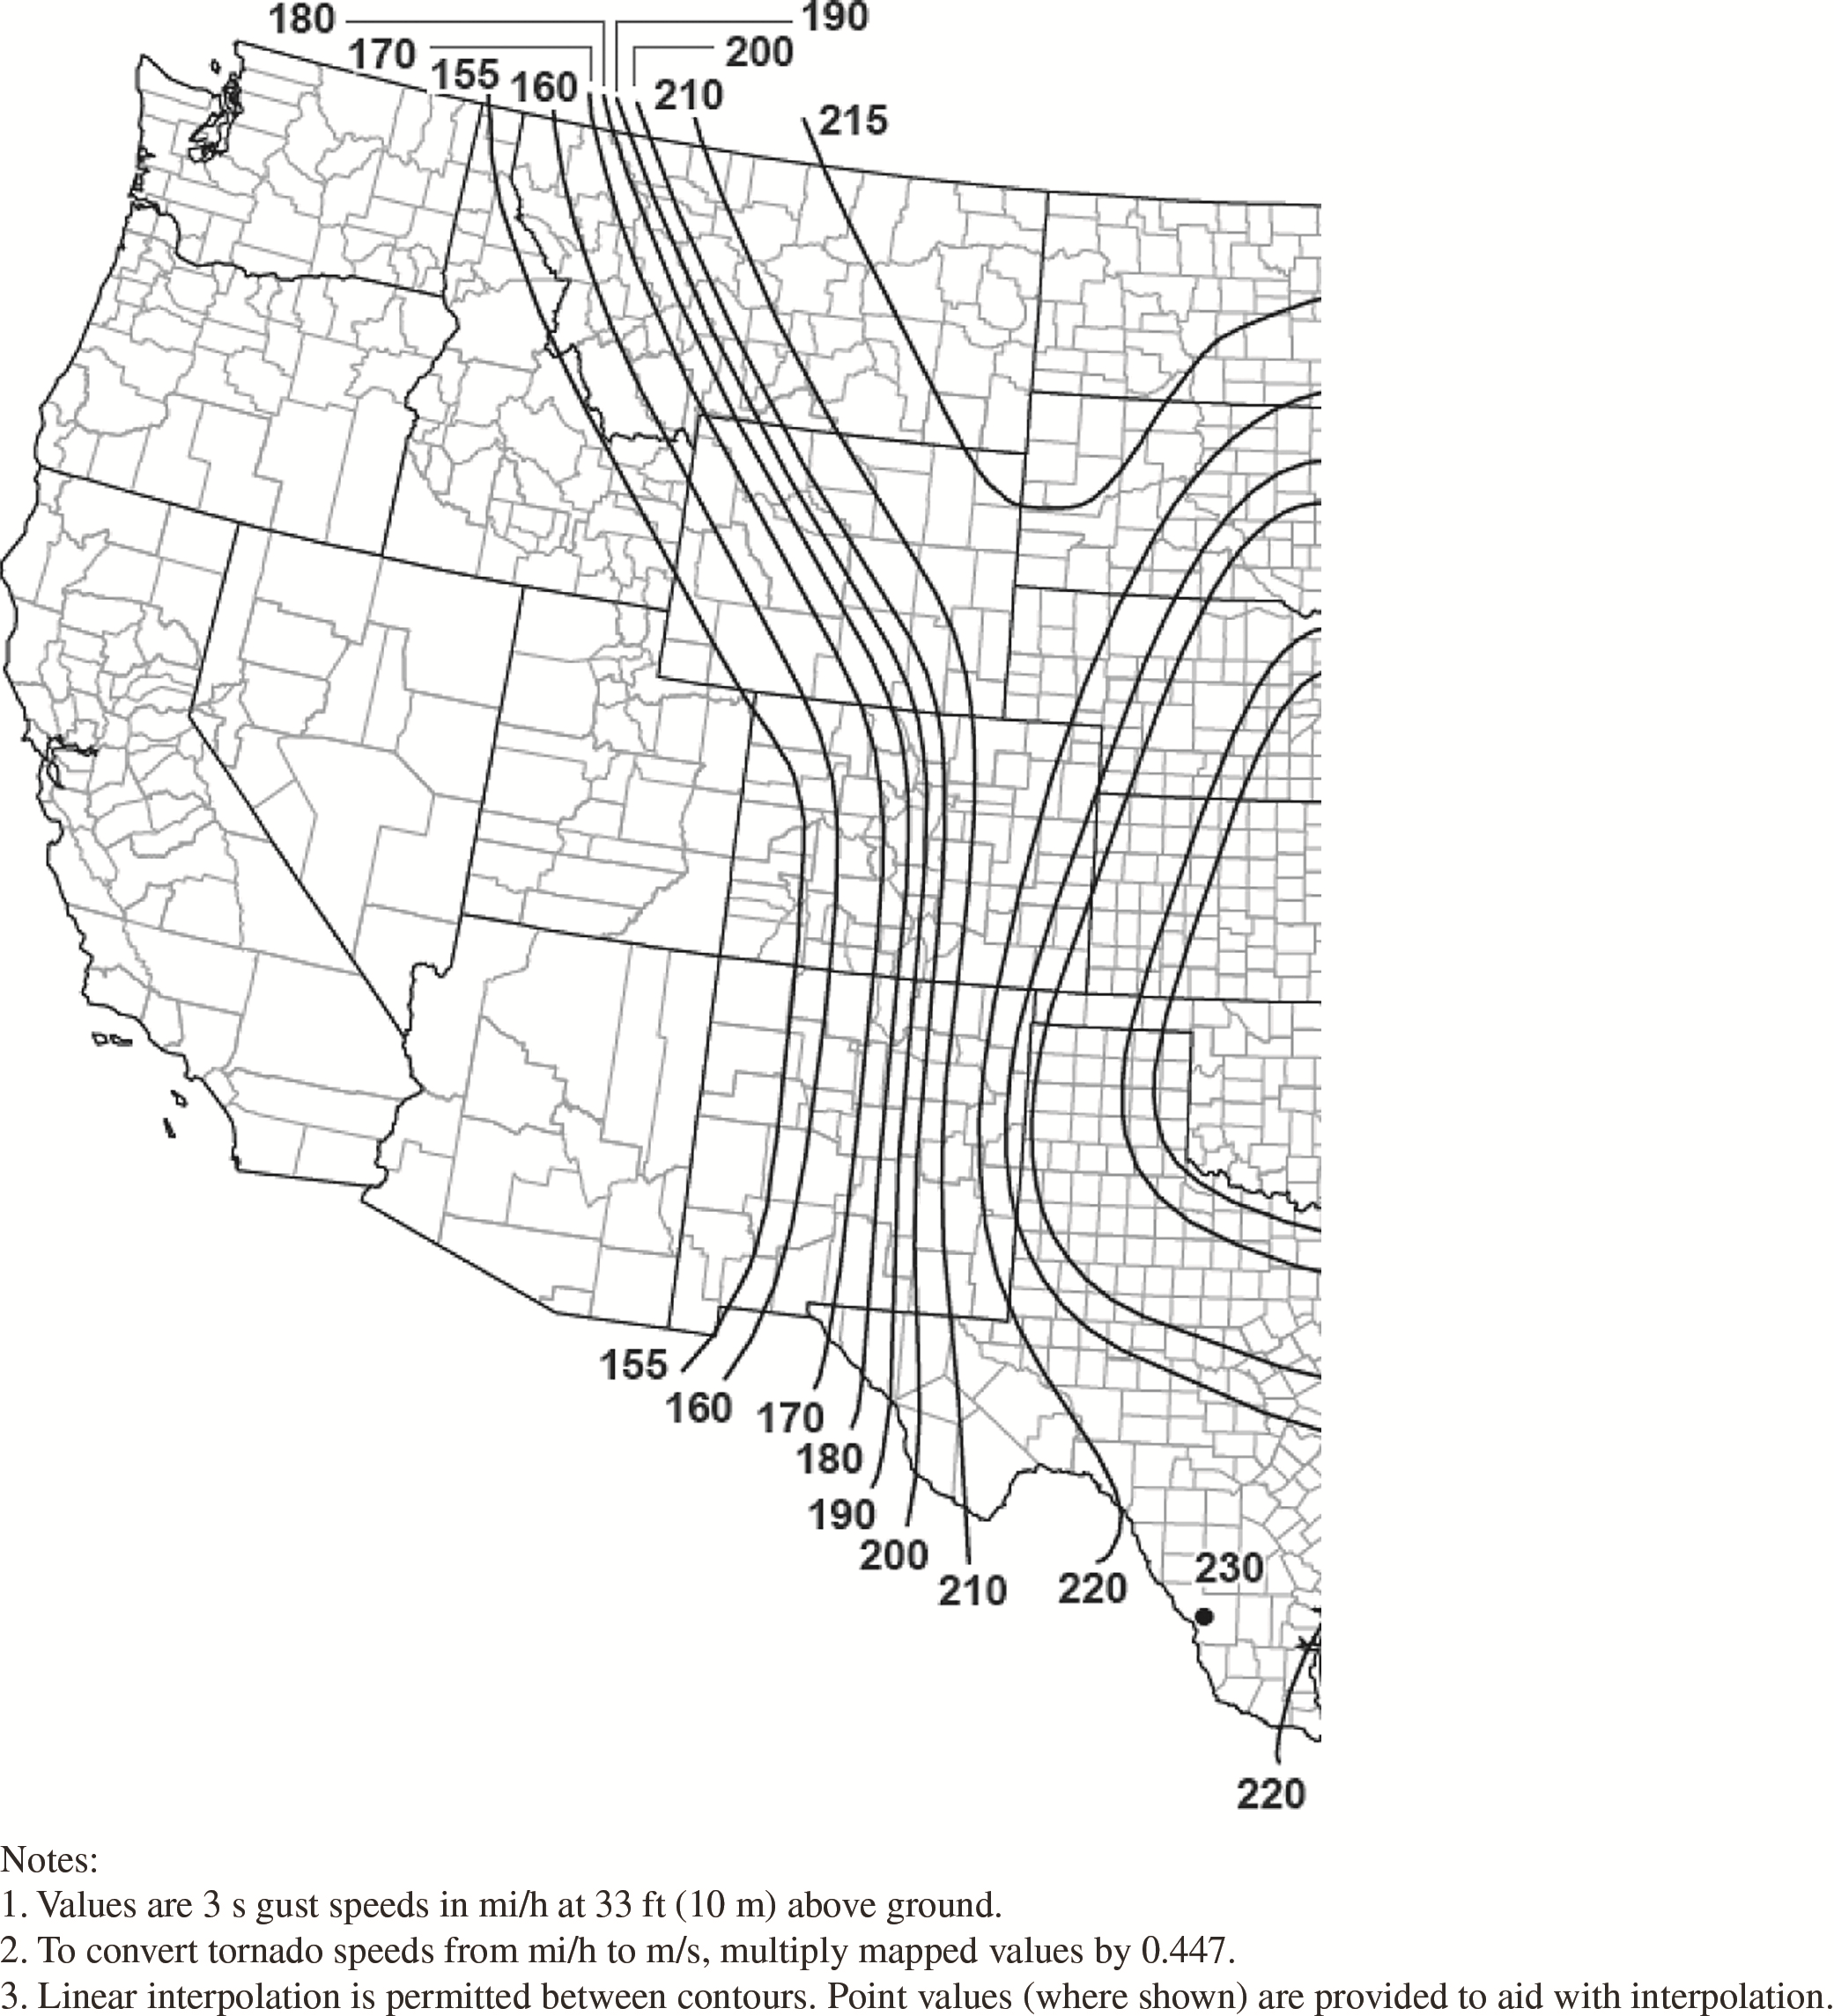
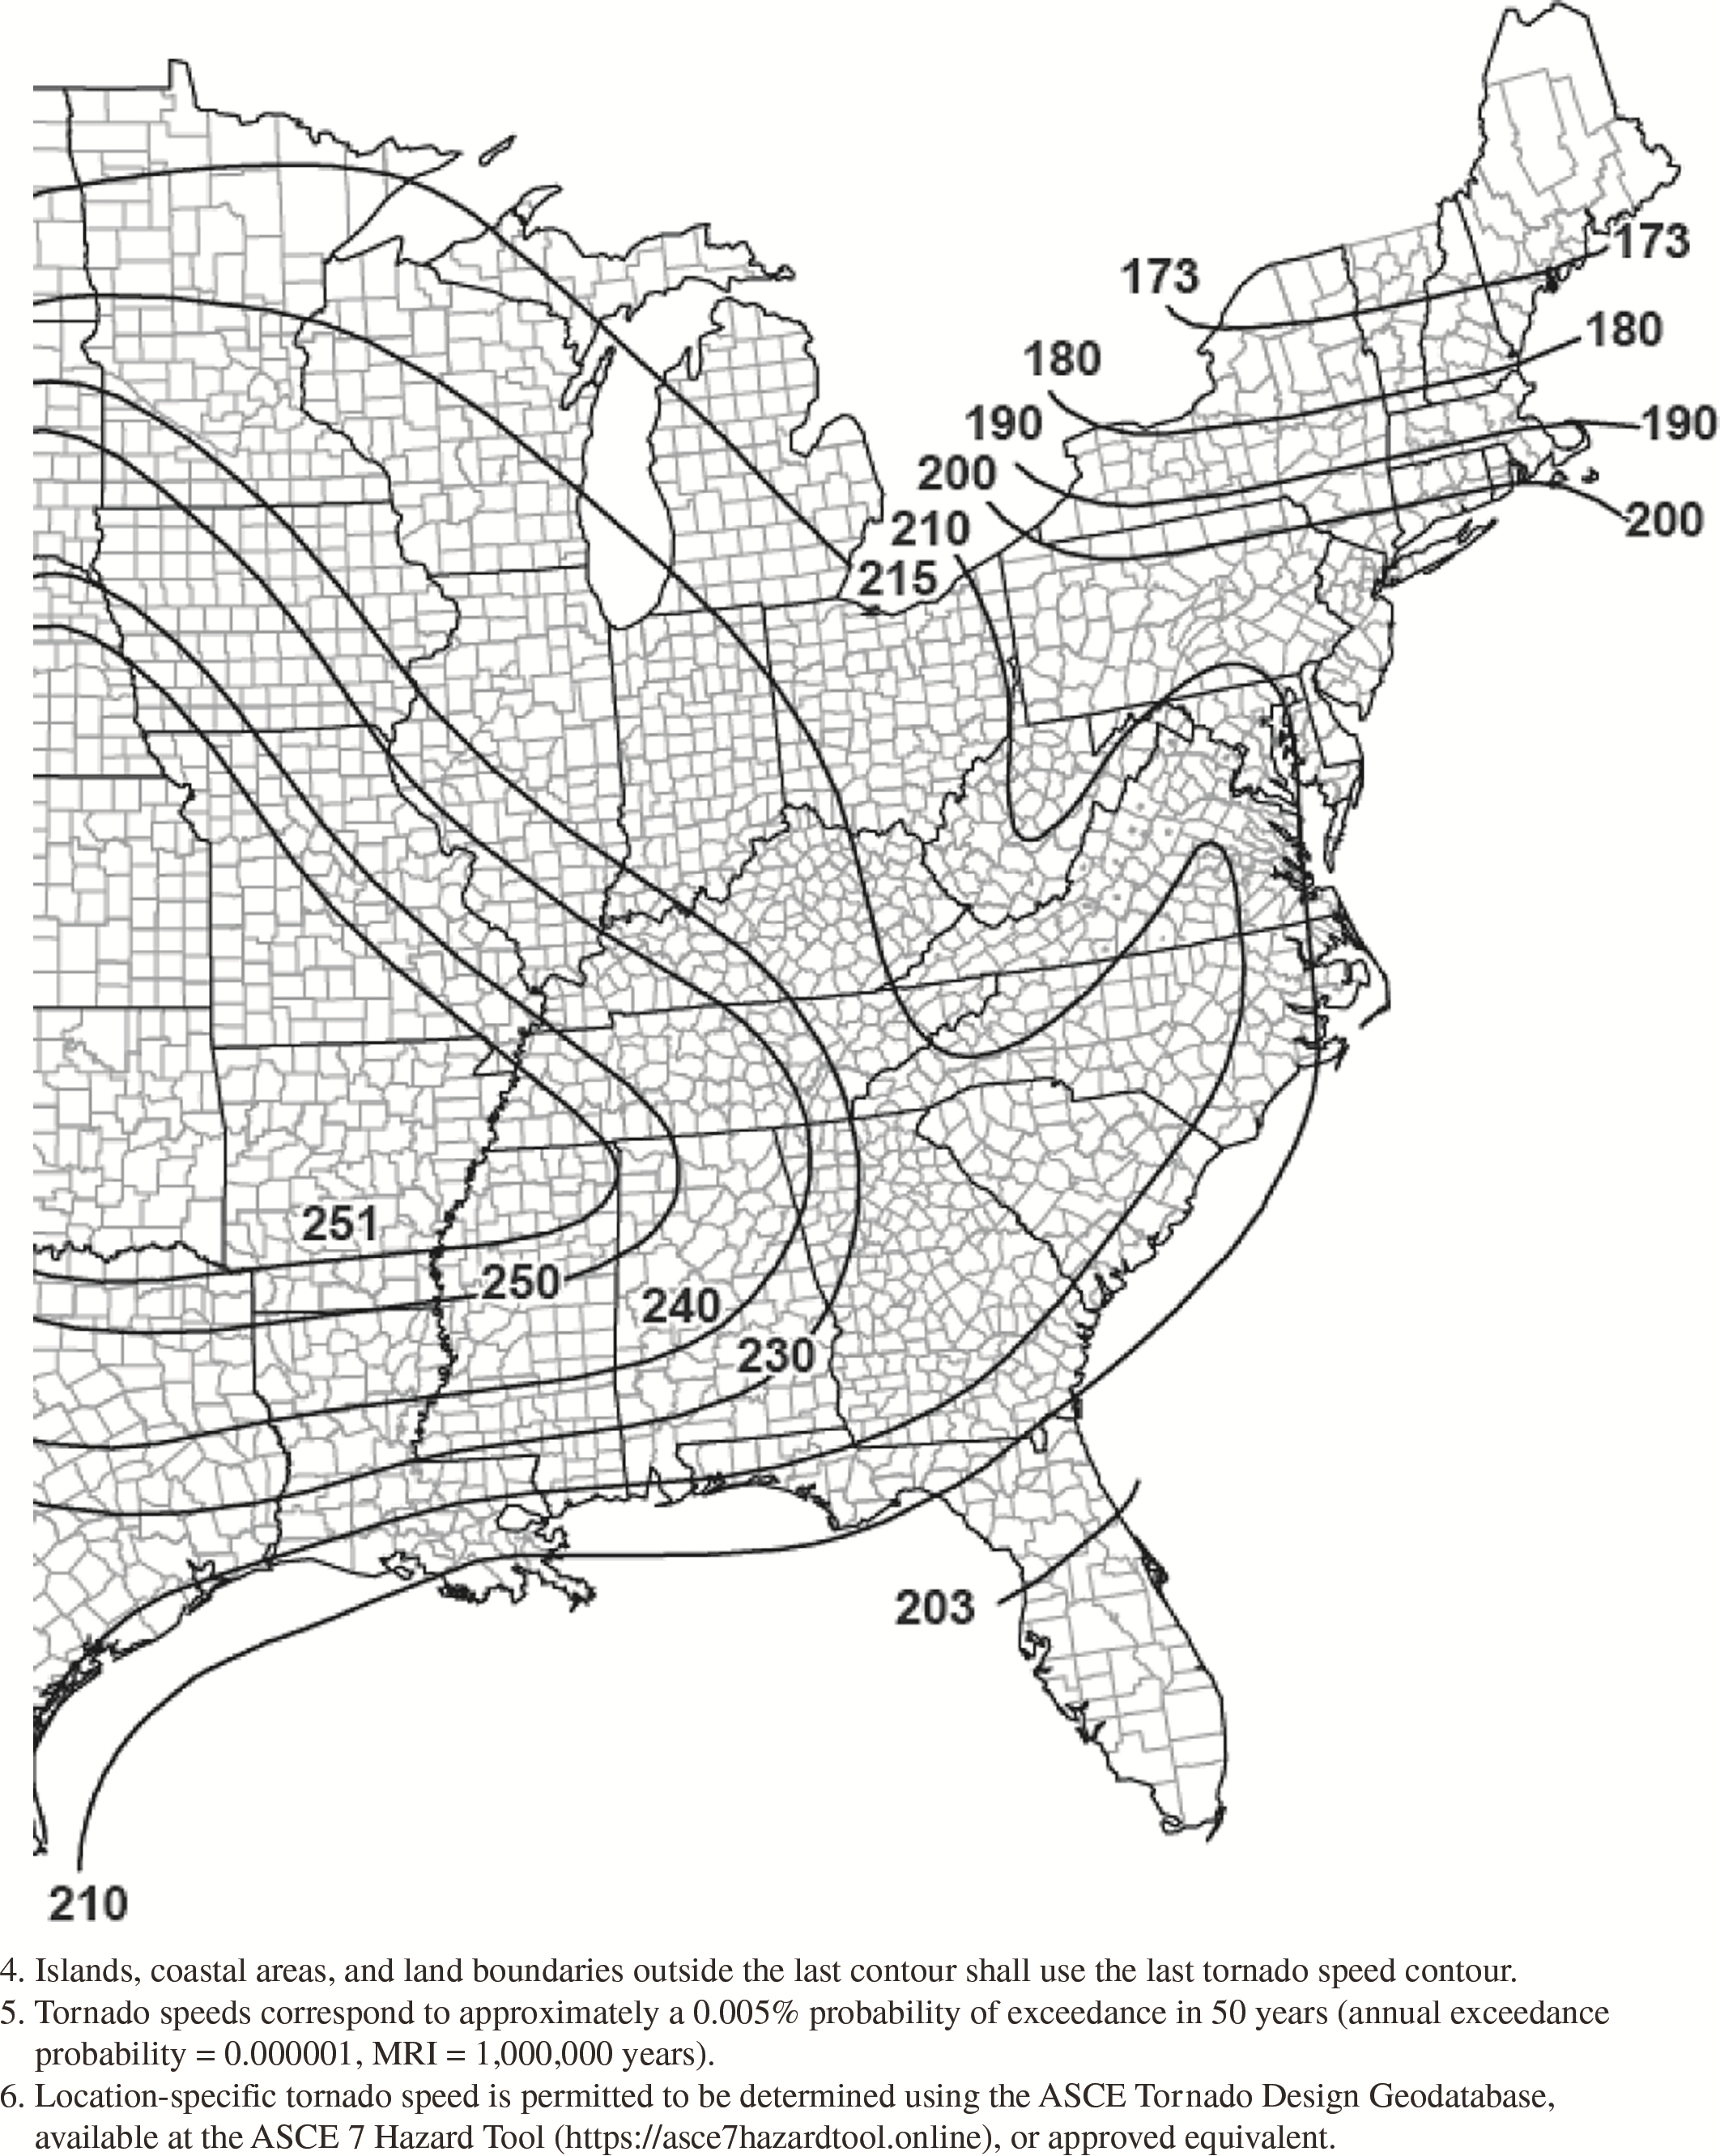
Figure G.2-4A. Tornado speeds for 10,000,000-year MRI for
effective plan area of 1
ft2
(0.1 m2).
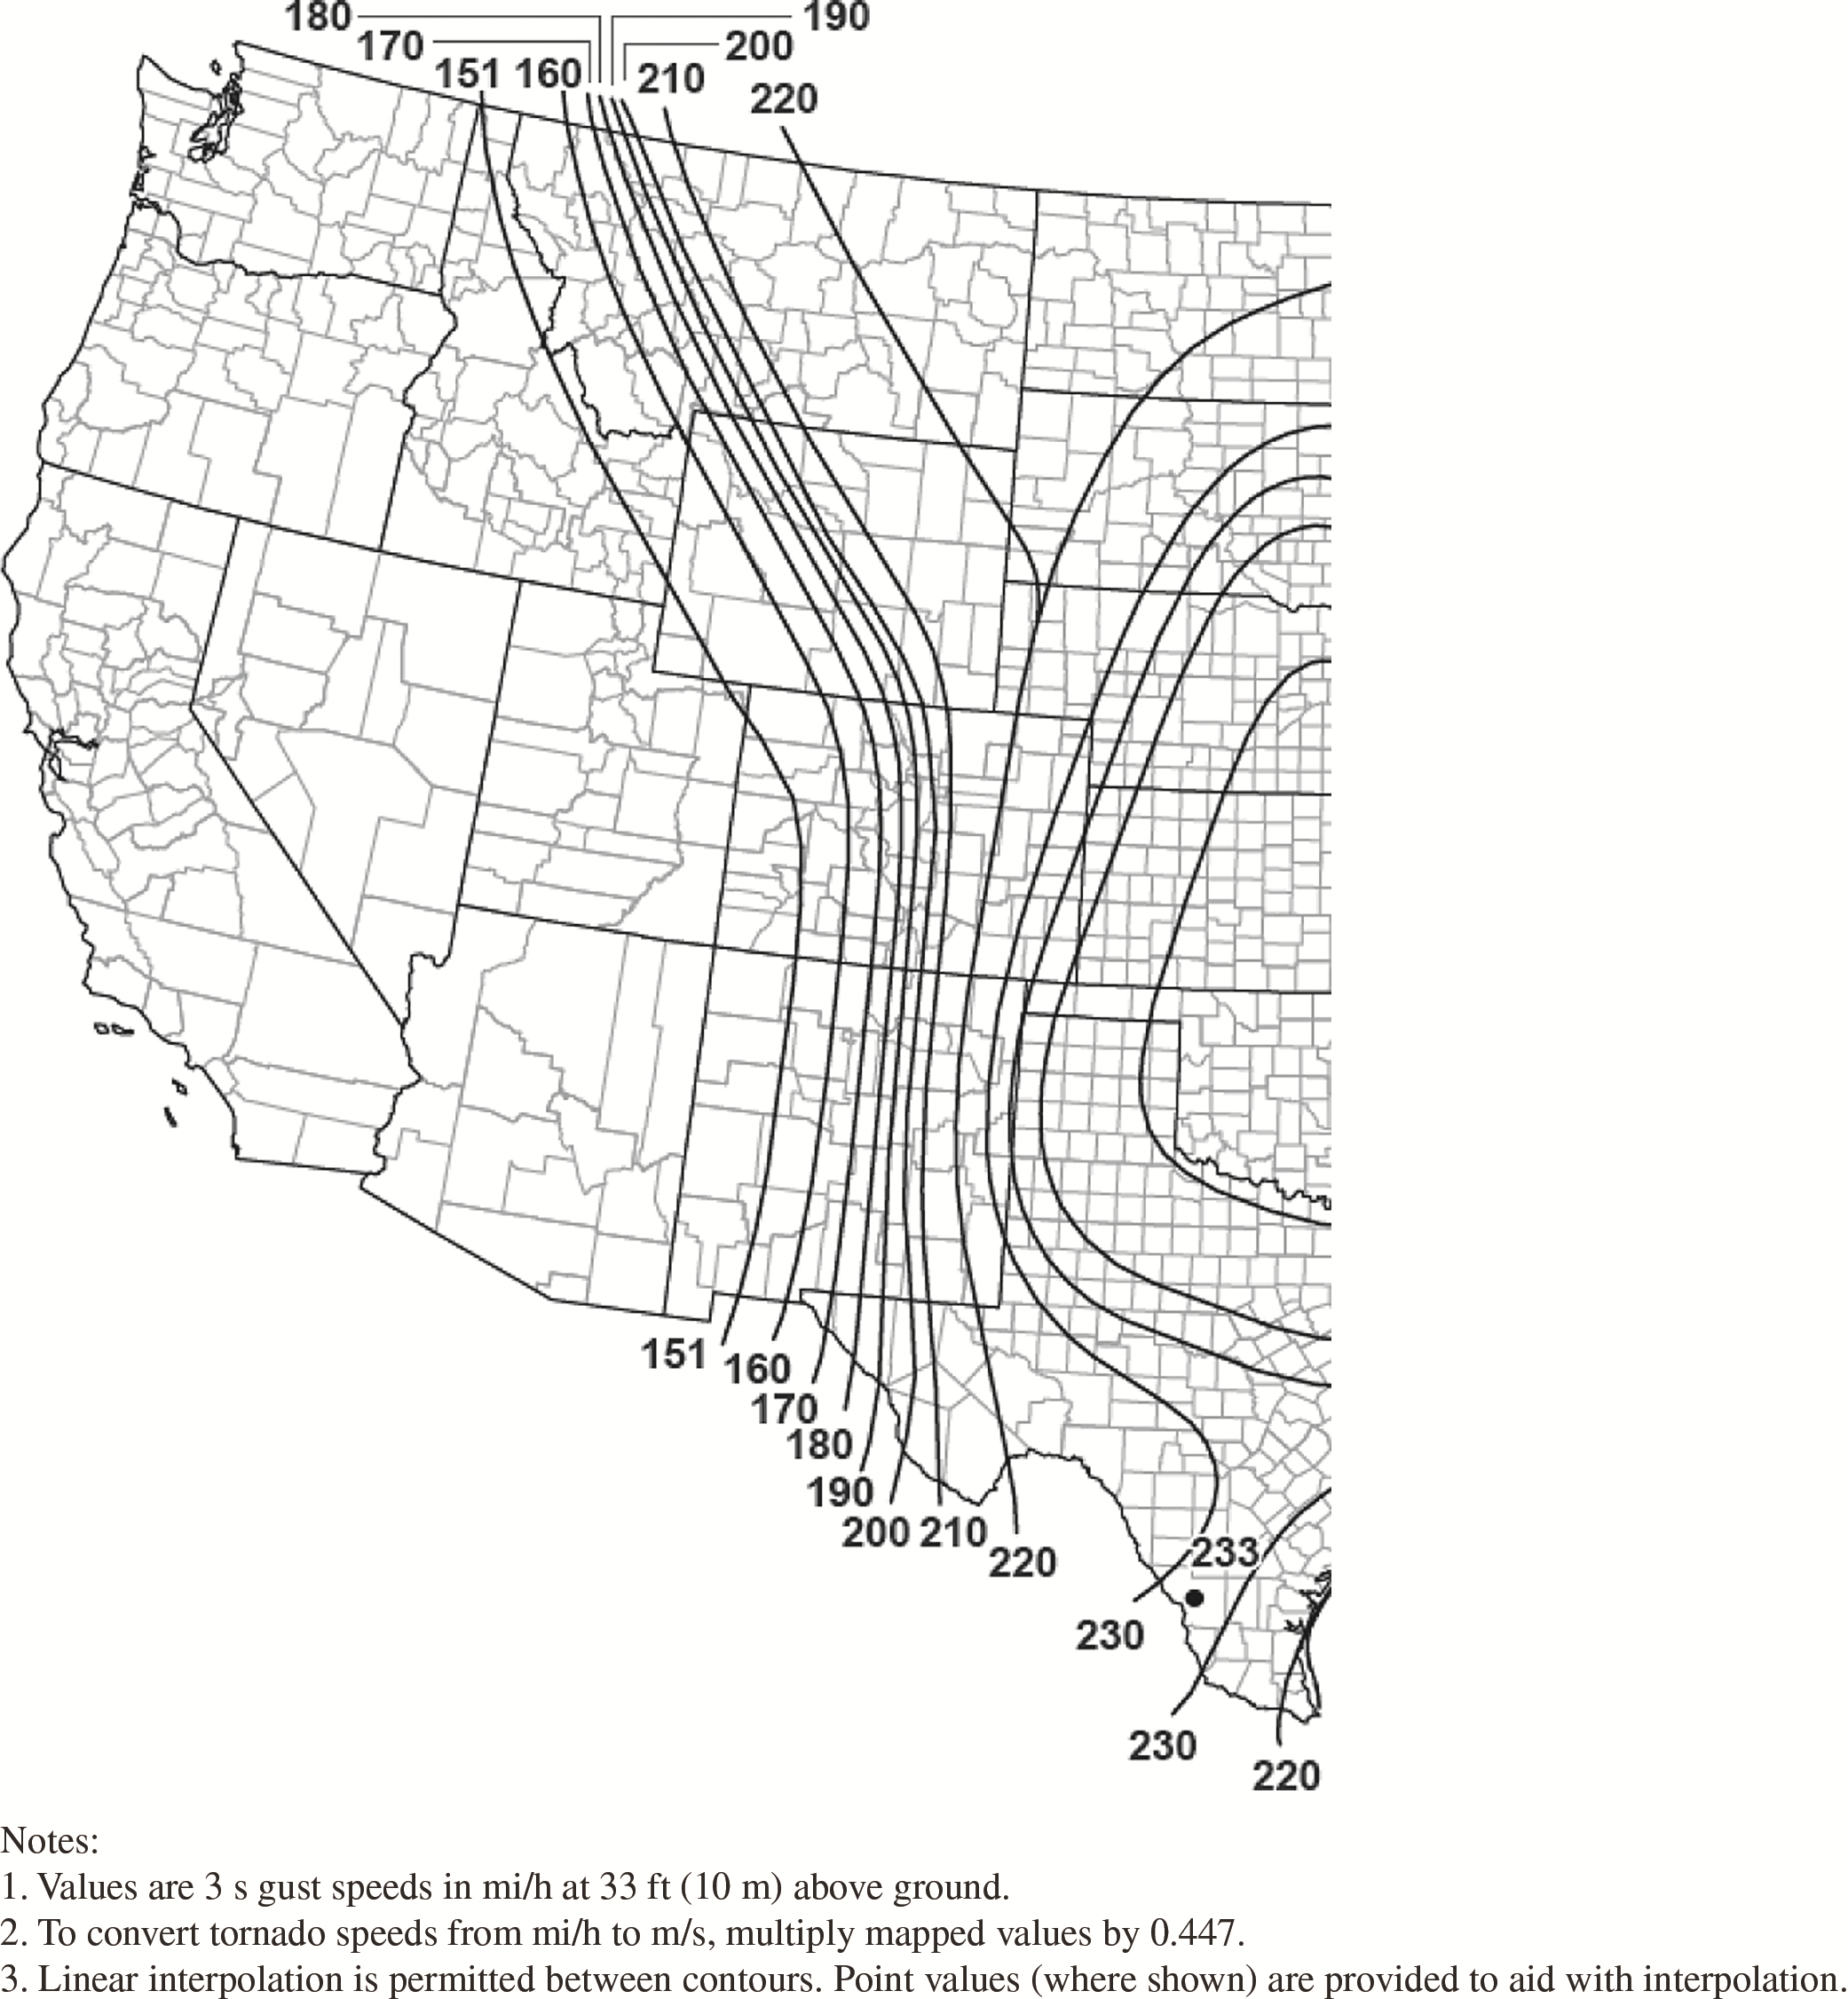
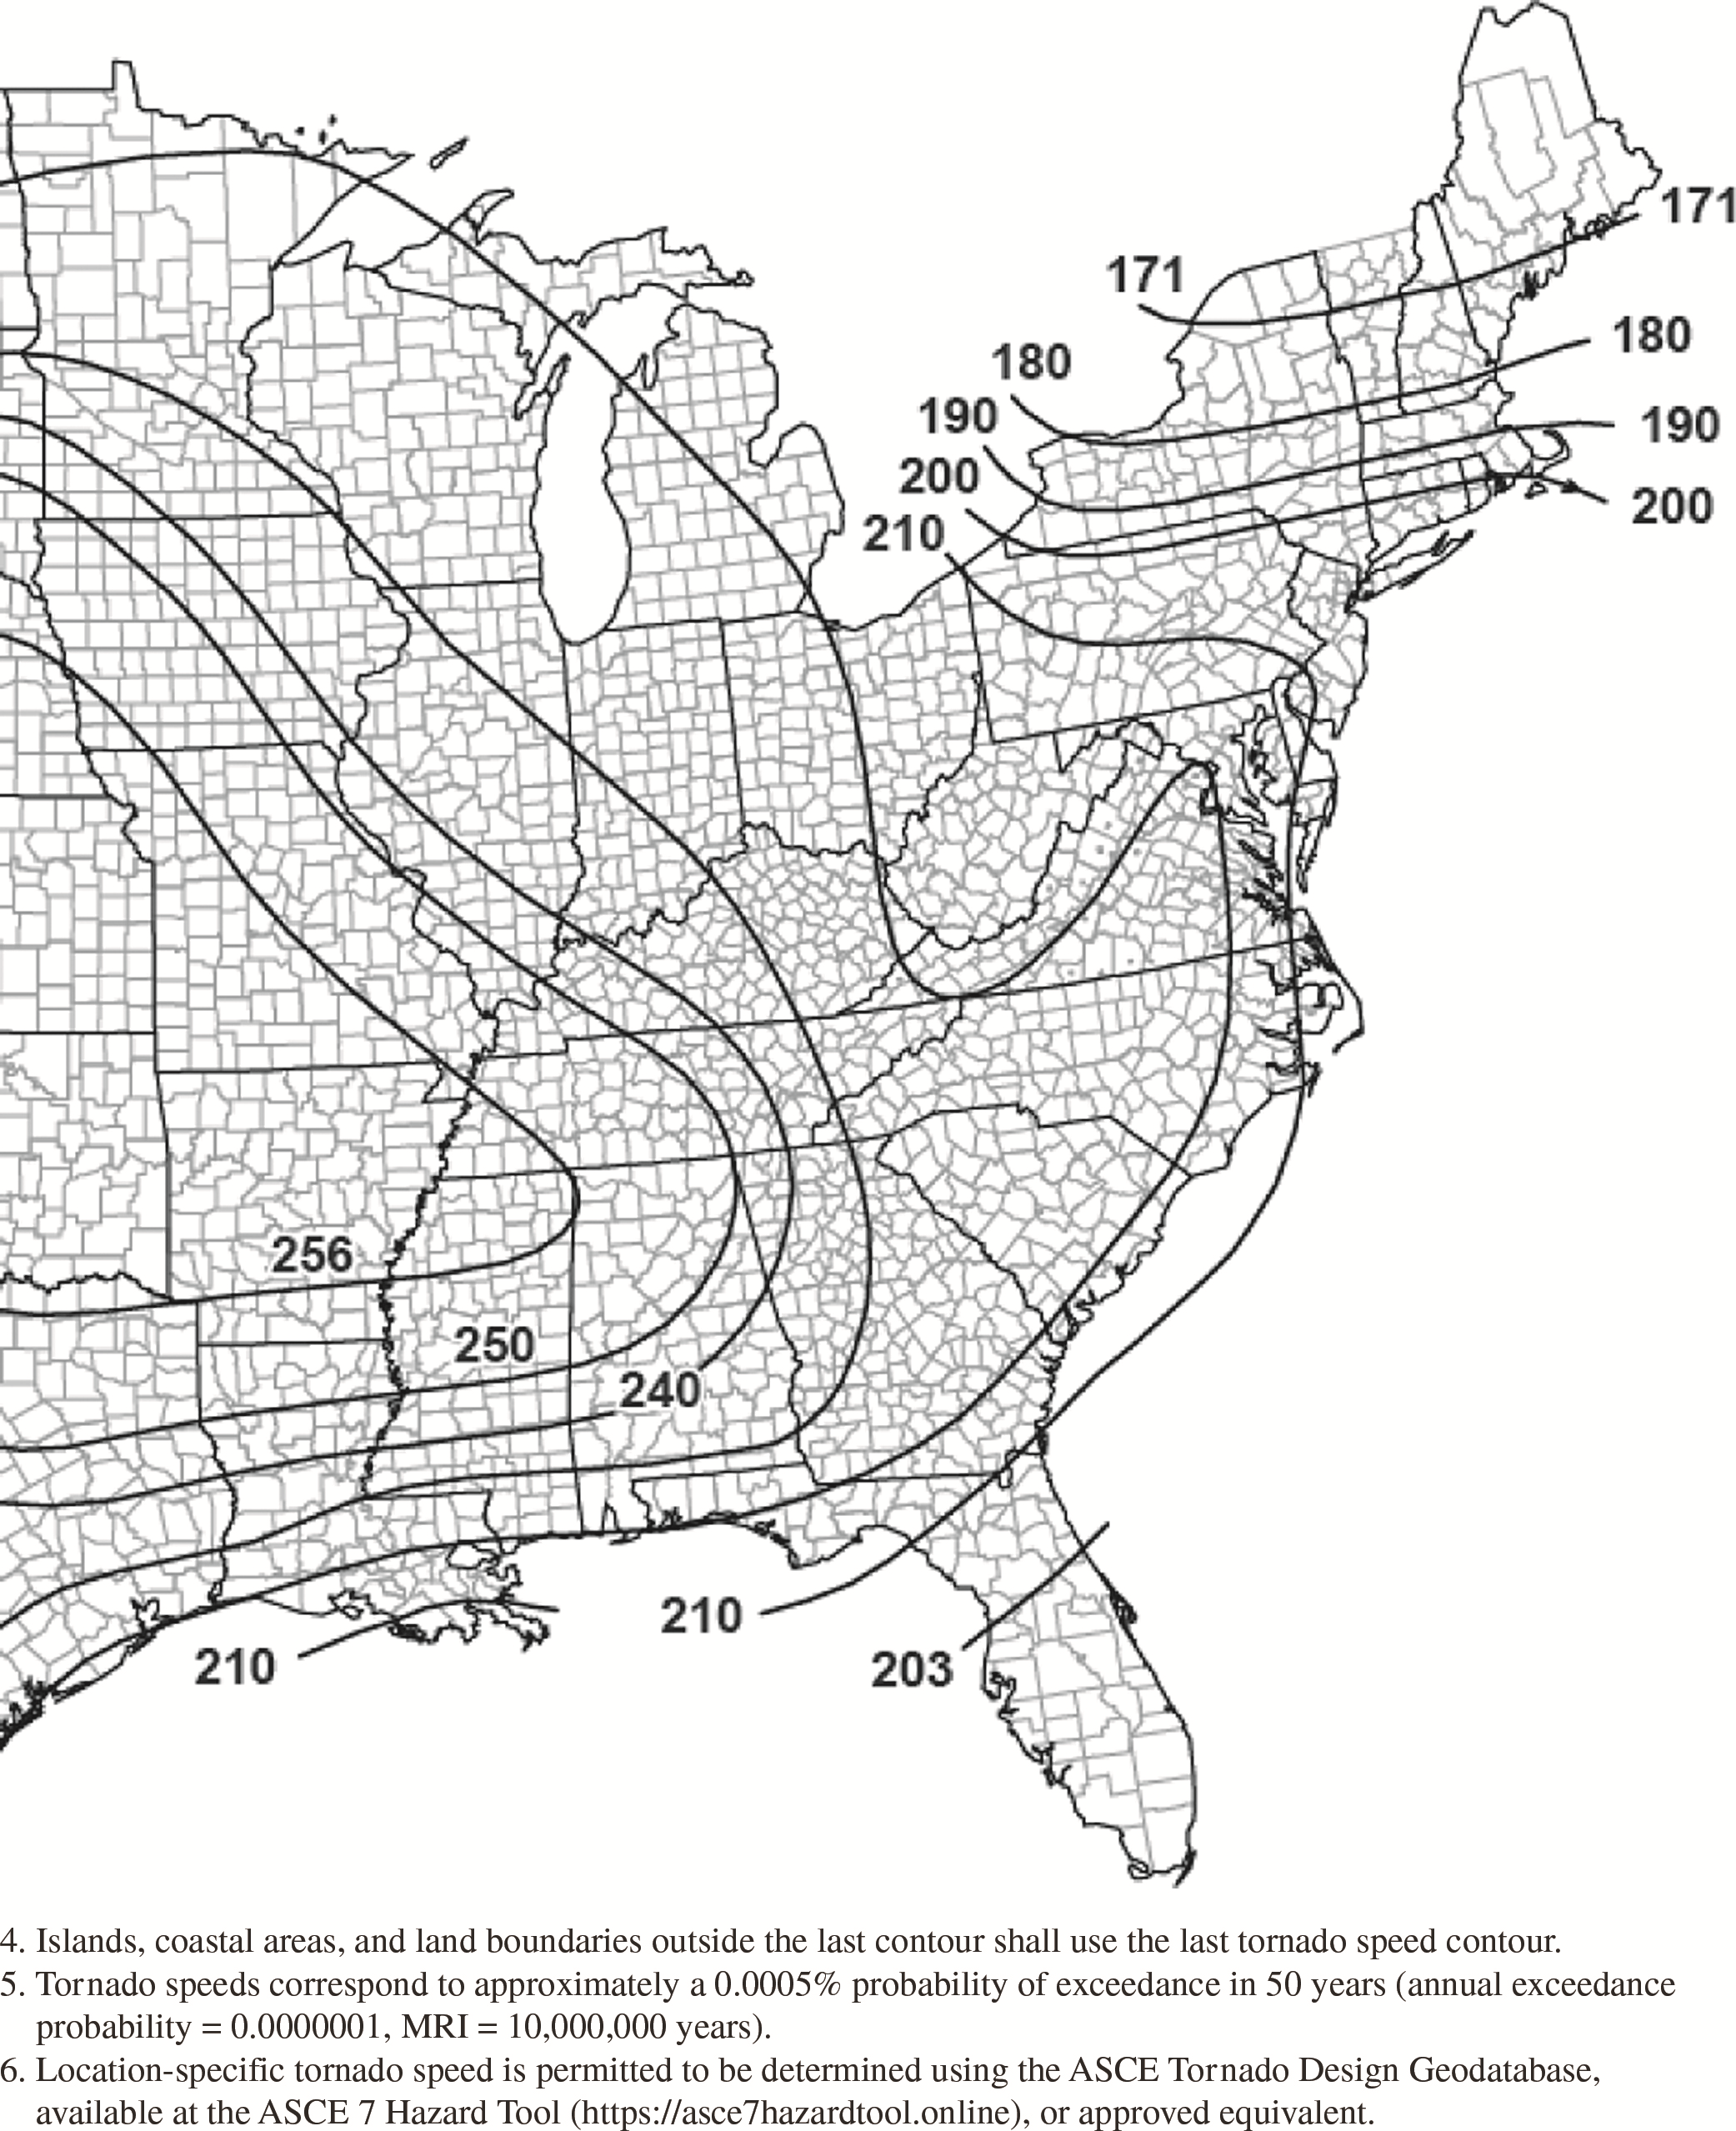
Figure G.2-4B. Tornado speeds for 10,000,000-year MRI for
effective plan area of 2,000
ft2
(186 m2).
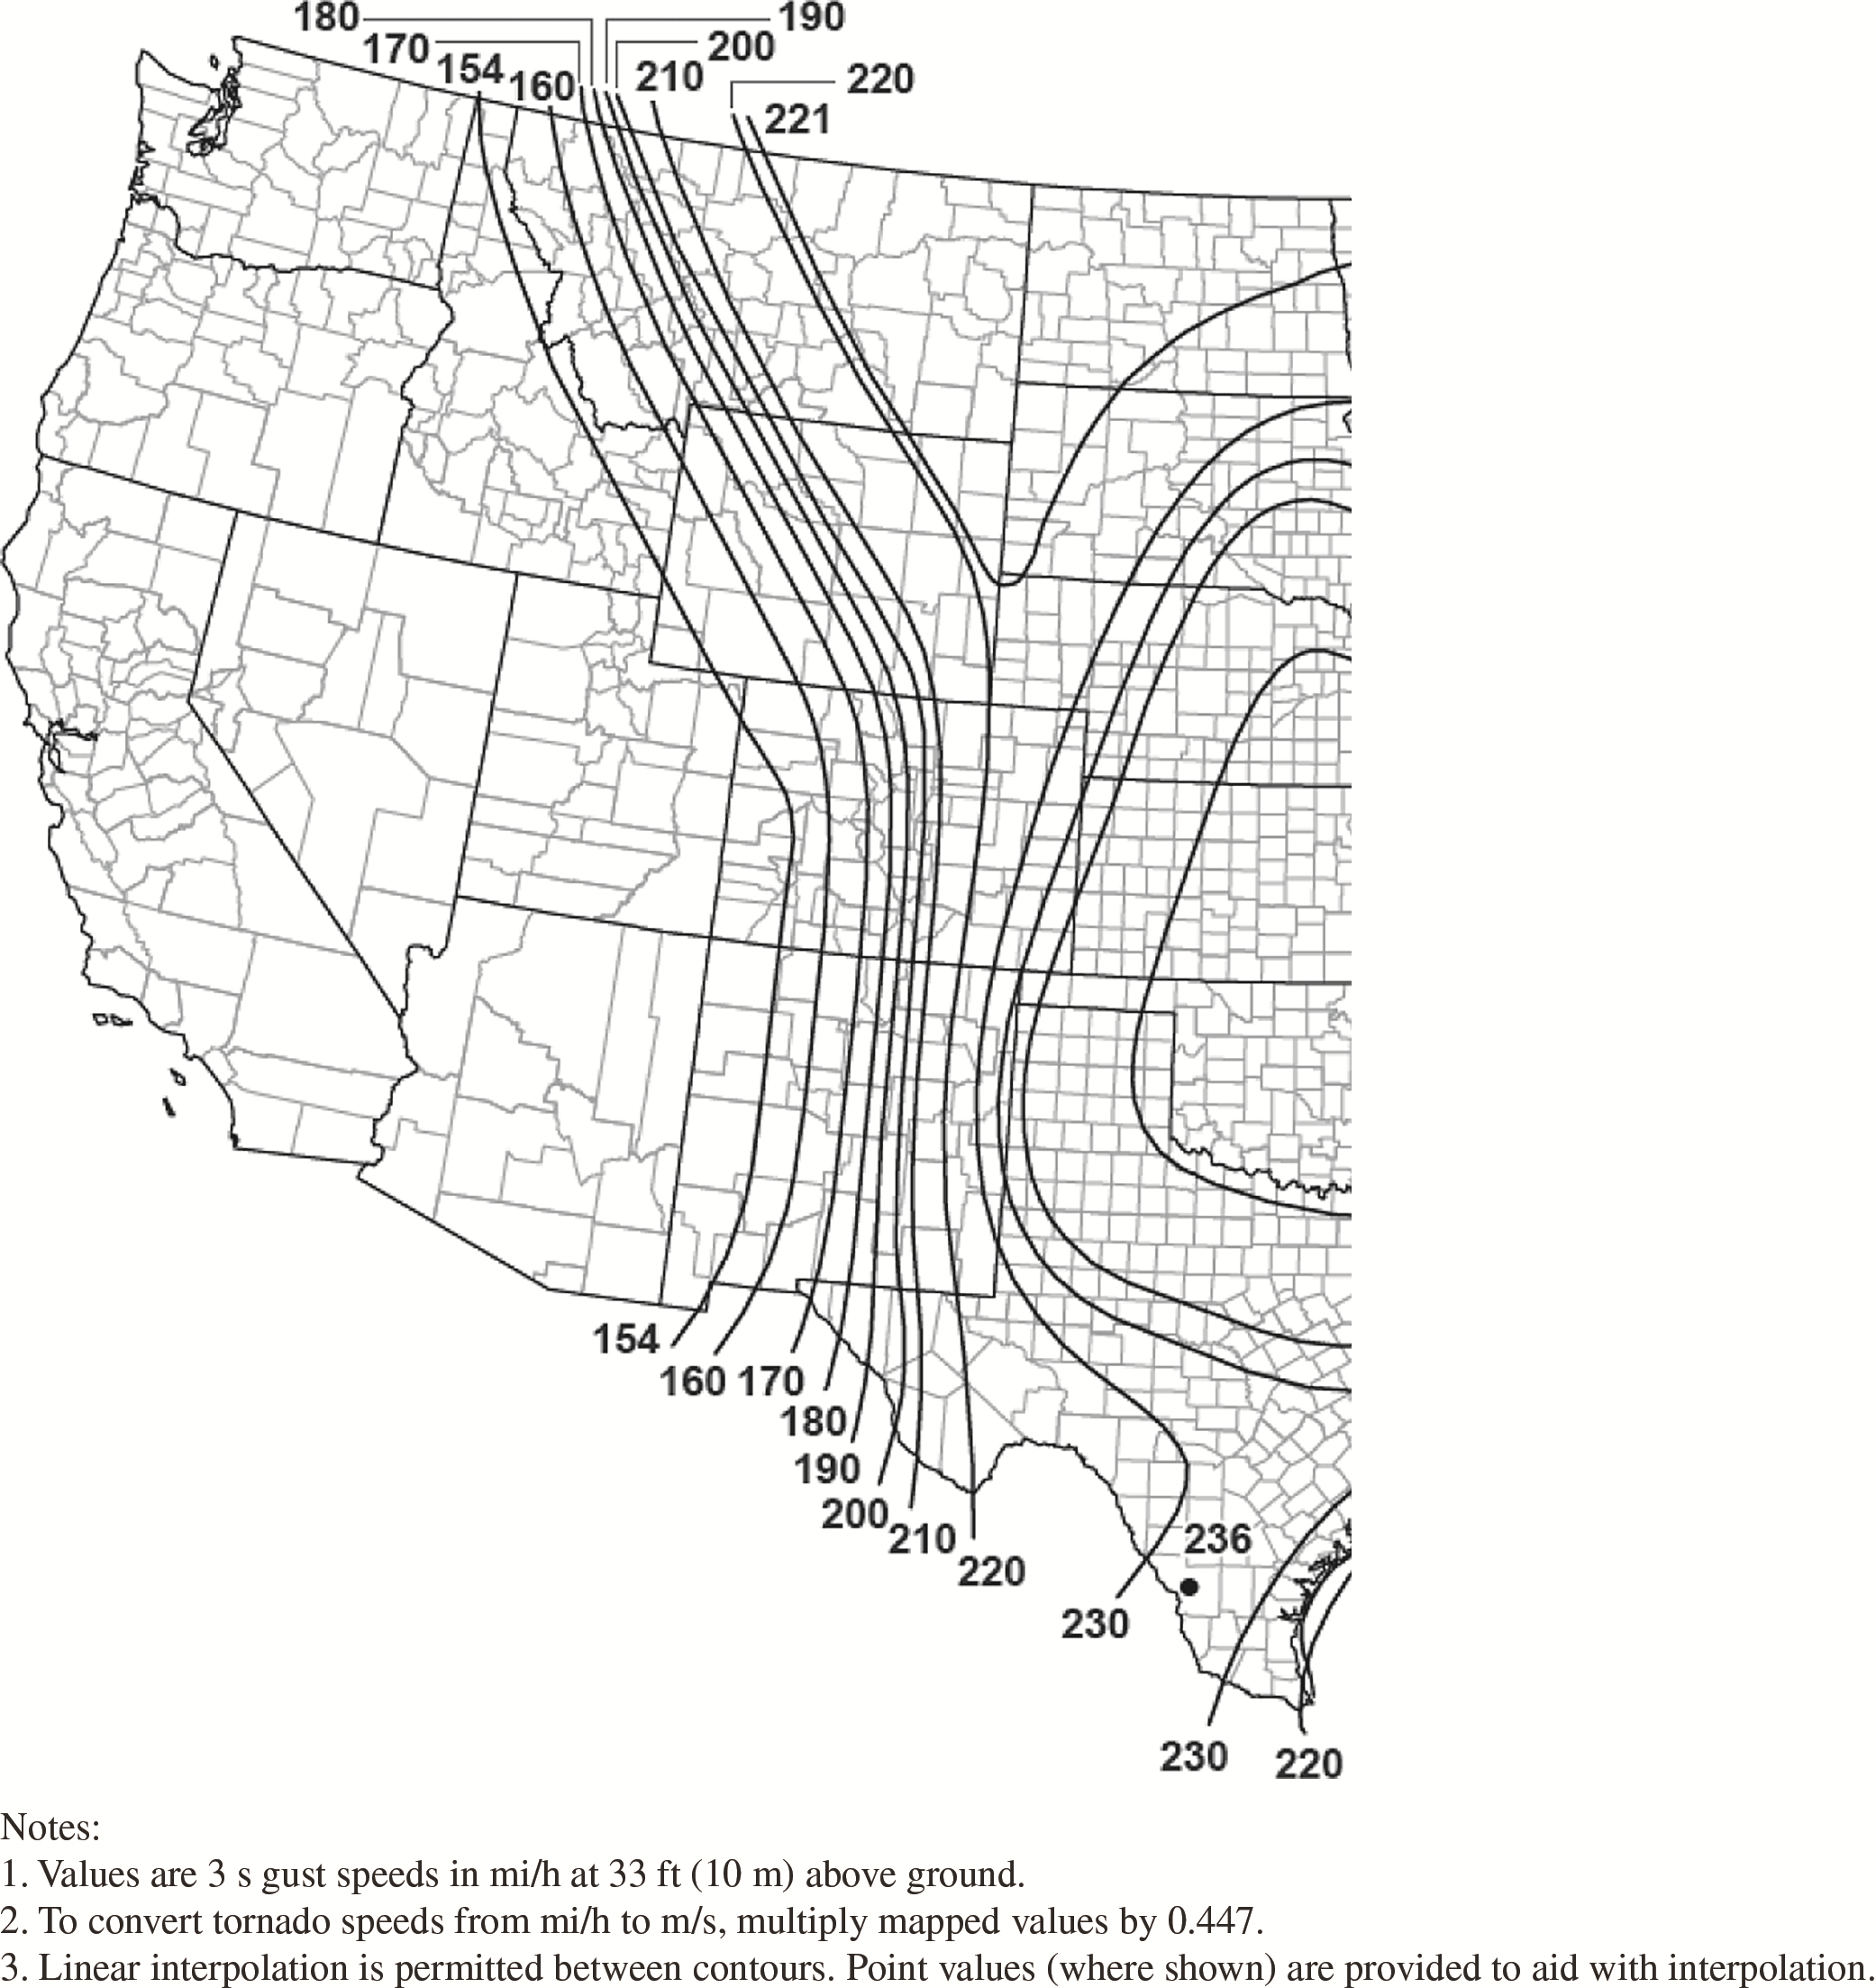
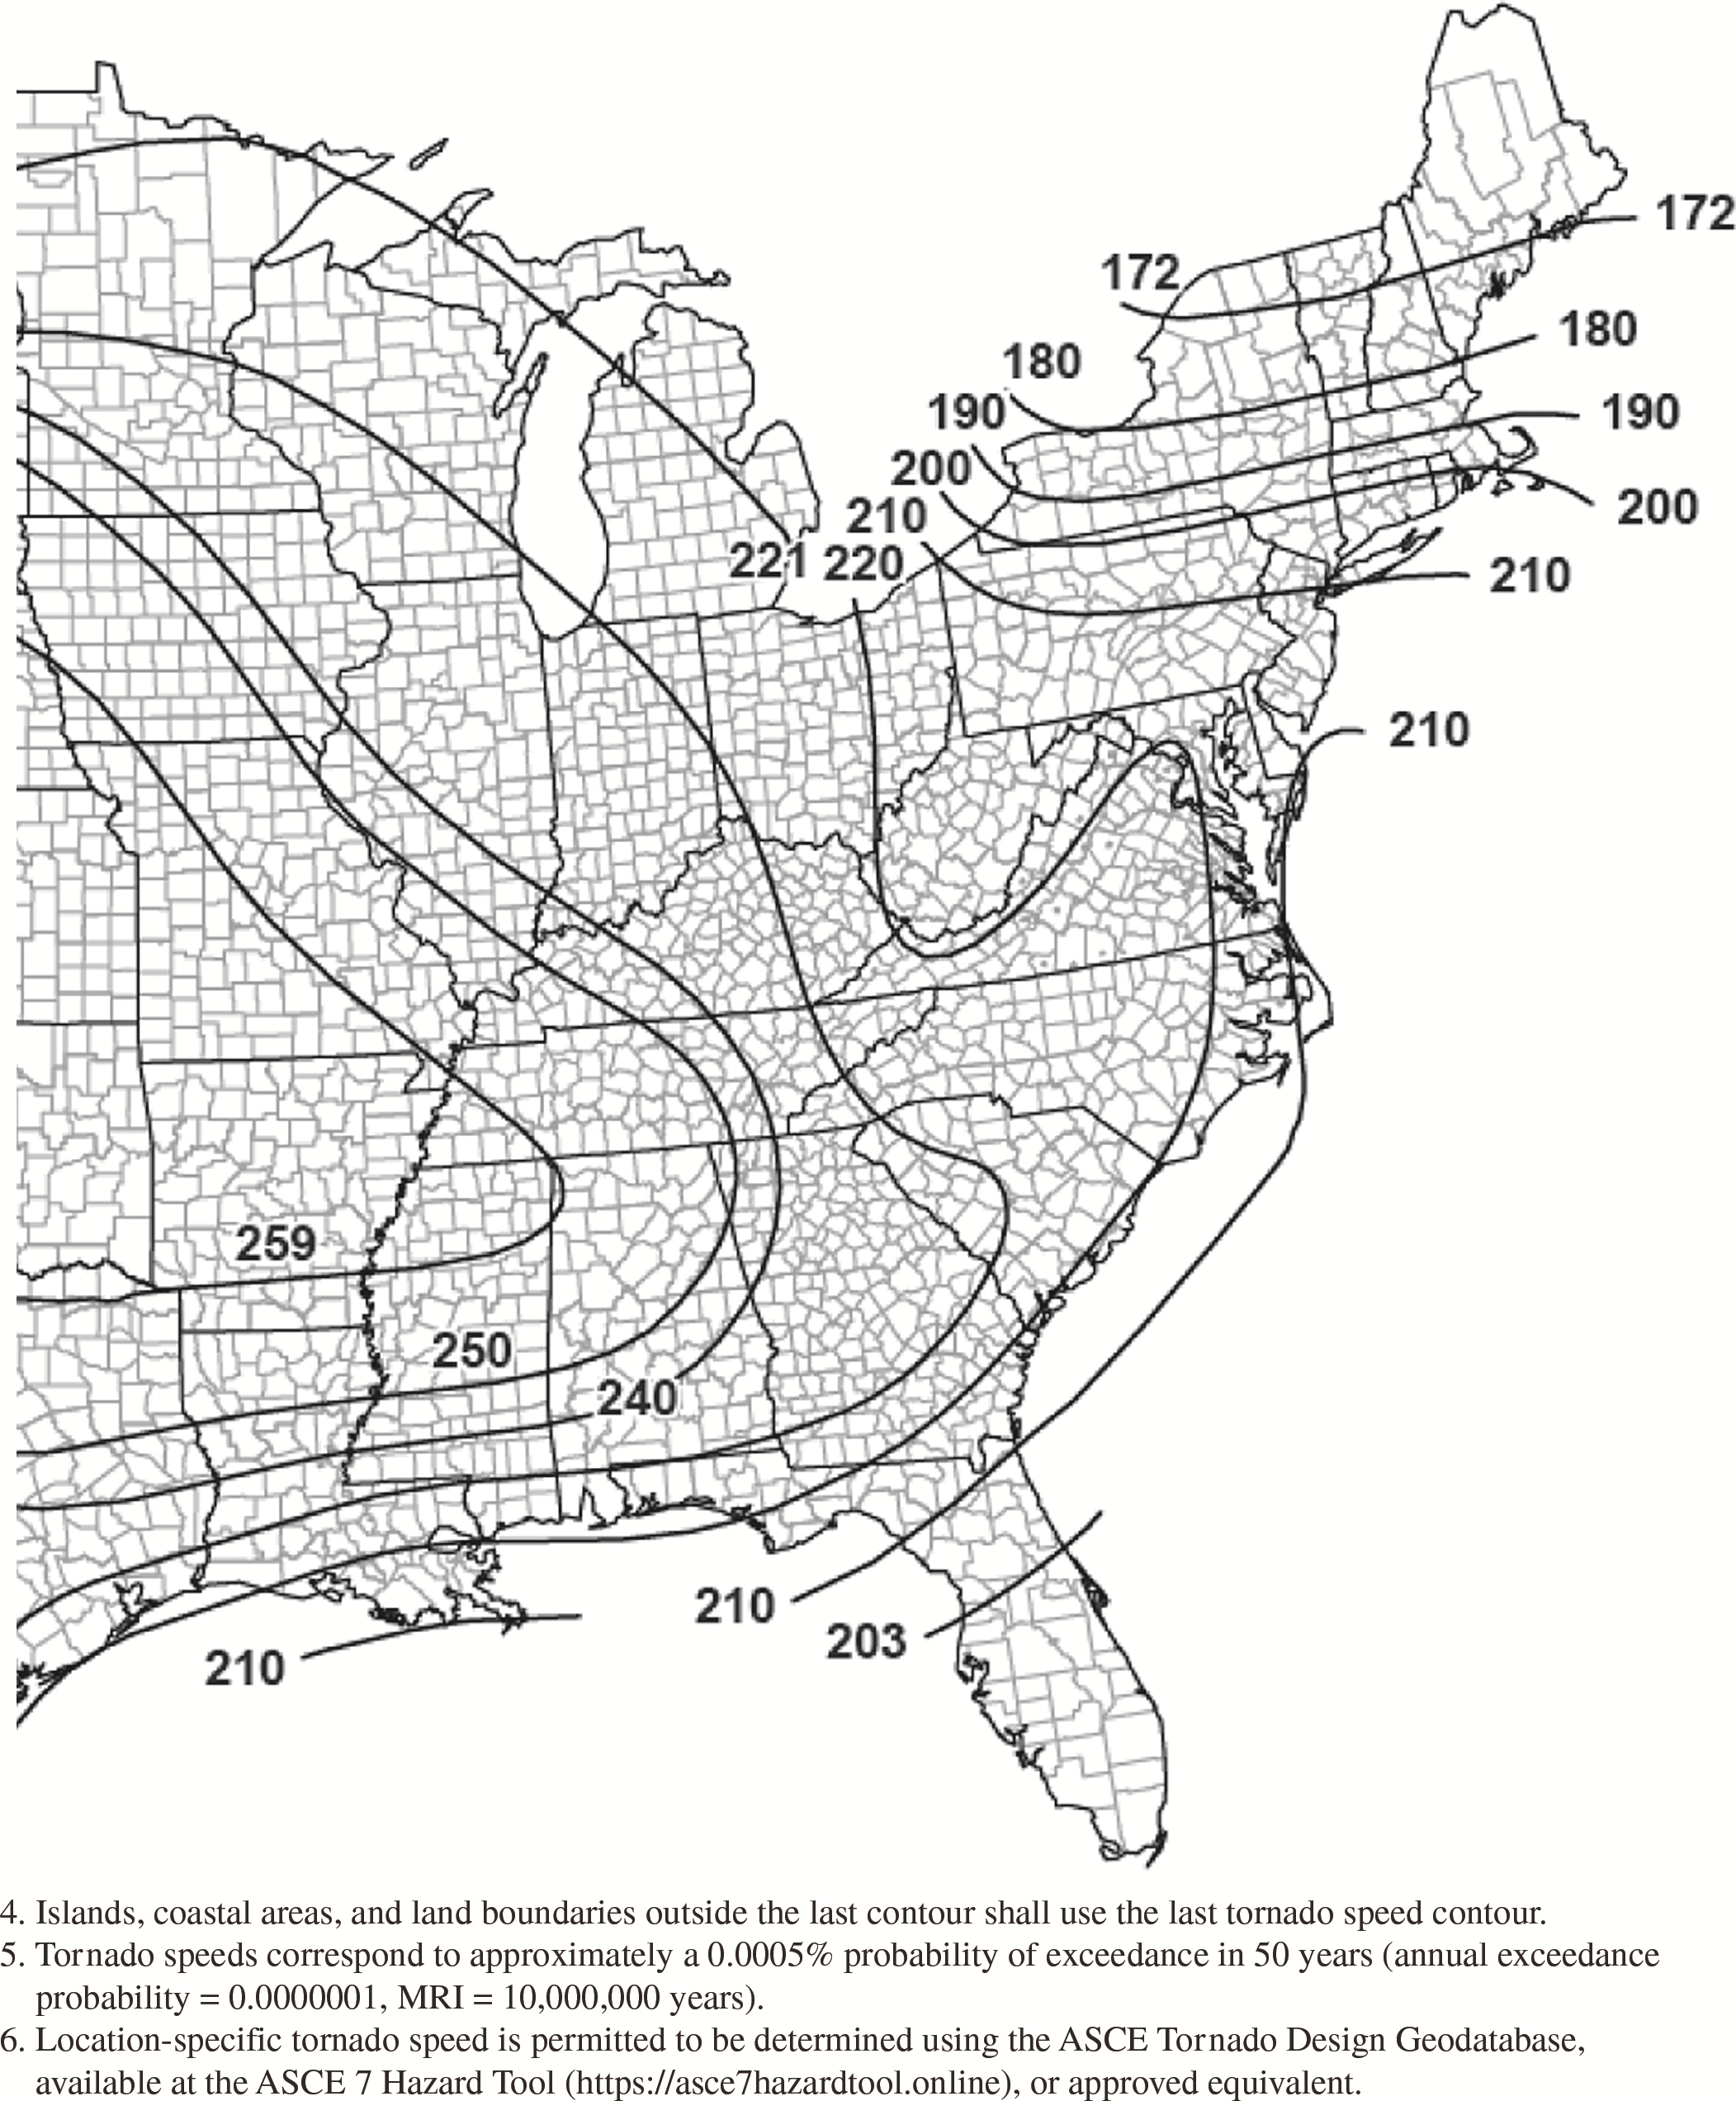
Figure G.2-4C. Tornado speeds for 10,000,000-year MRI for
effective plan area of 10,000
ft2
(929 m2).
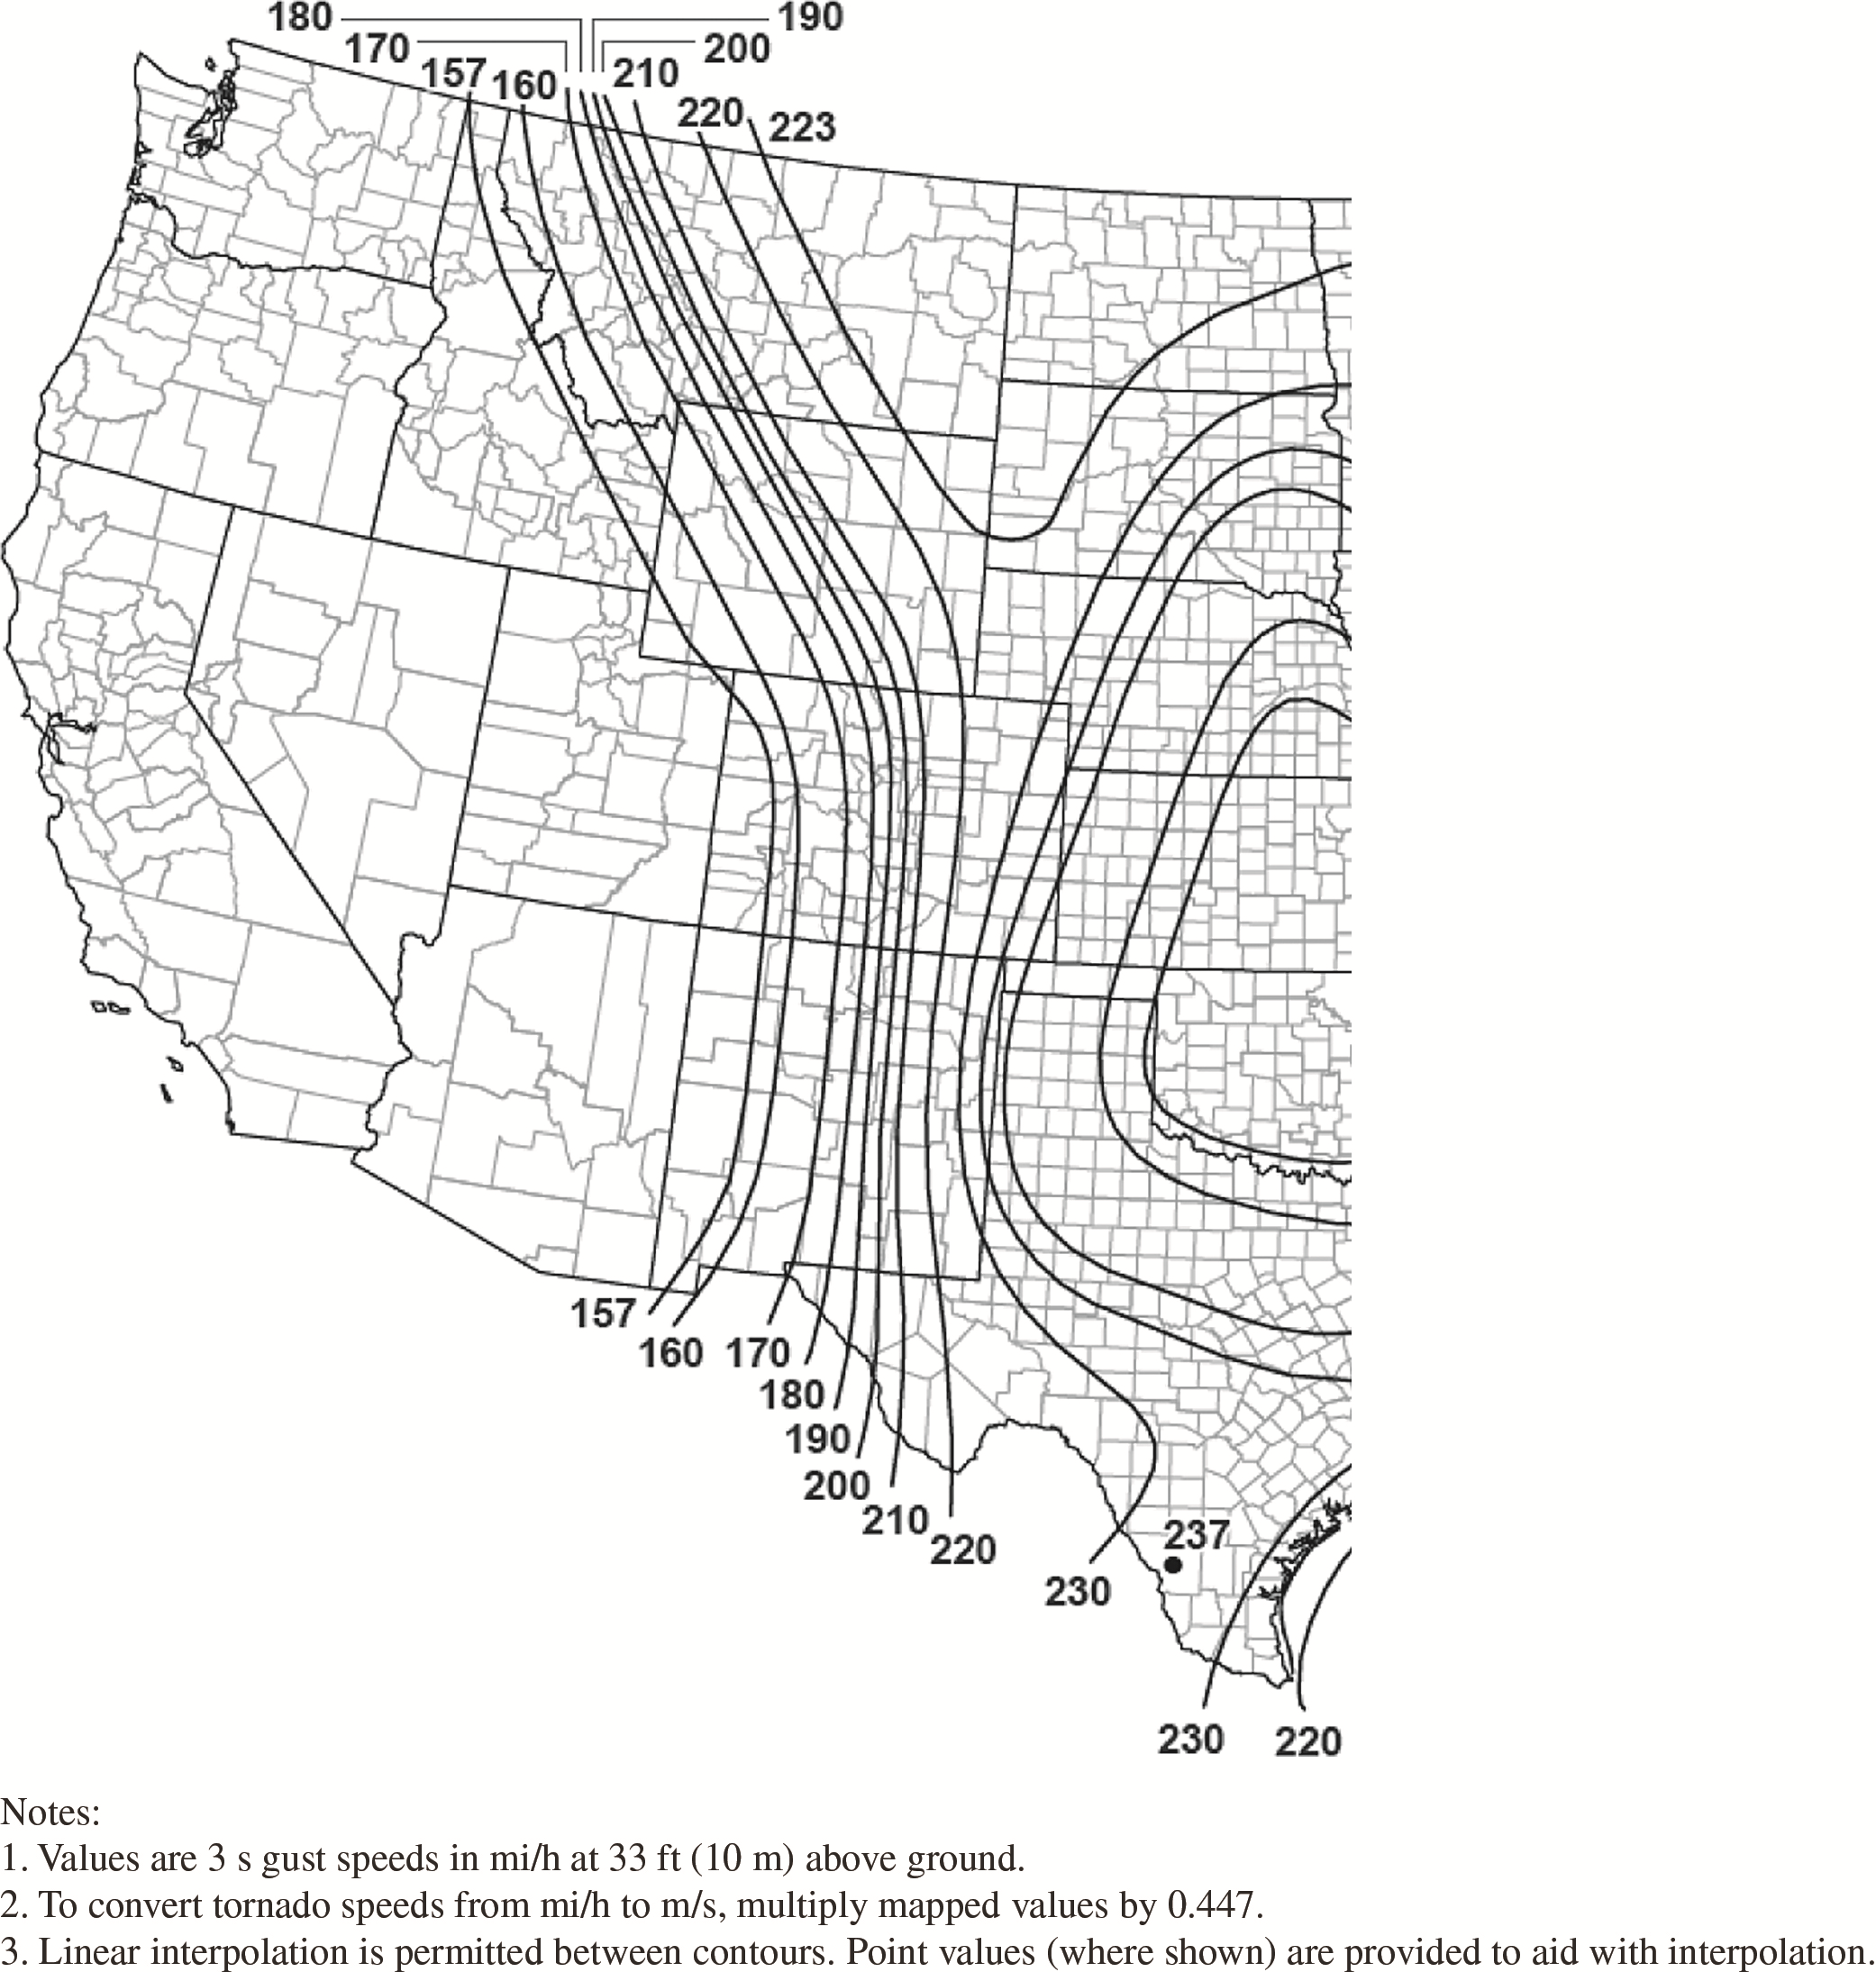
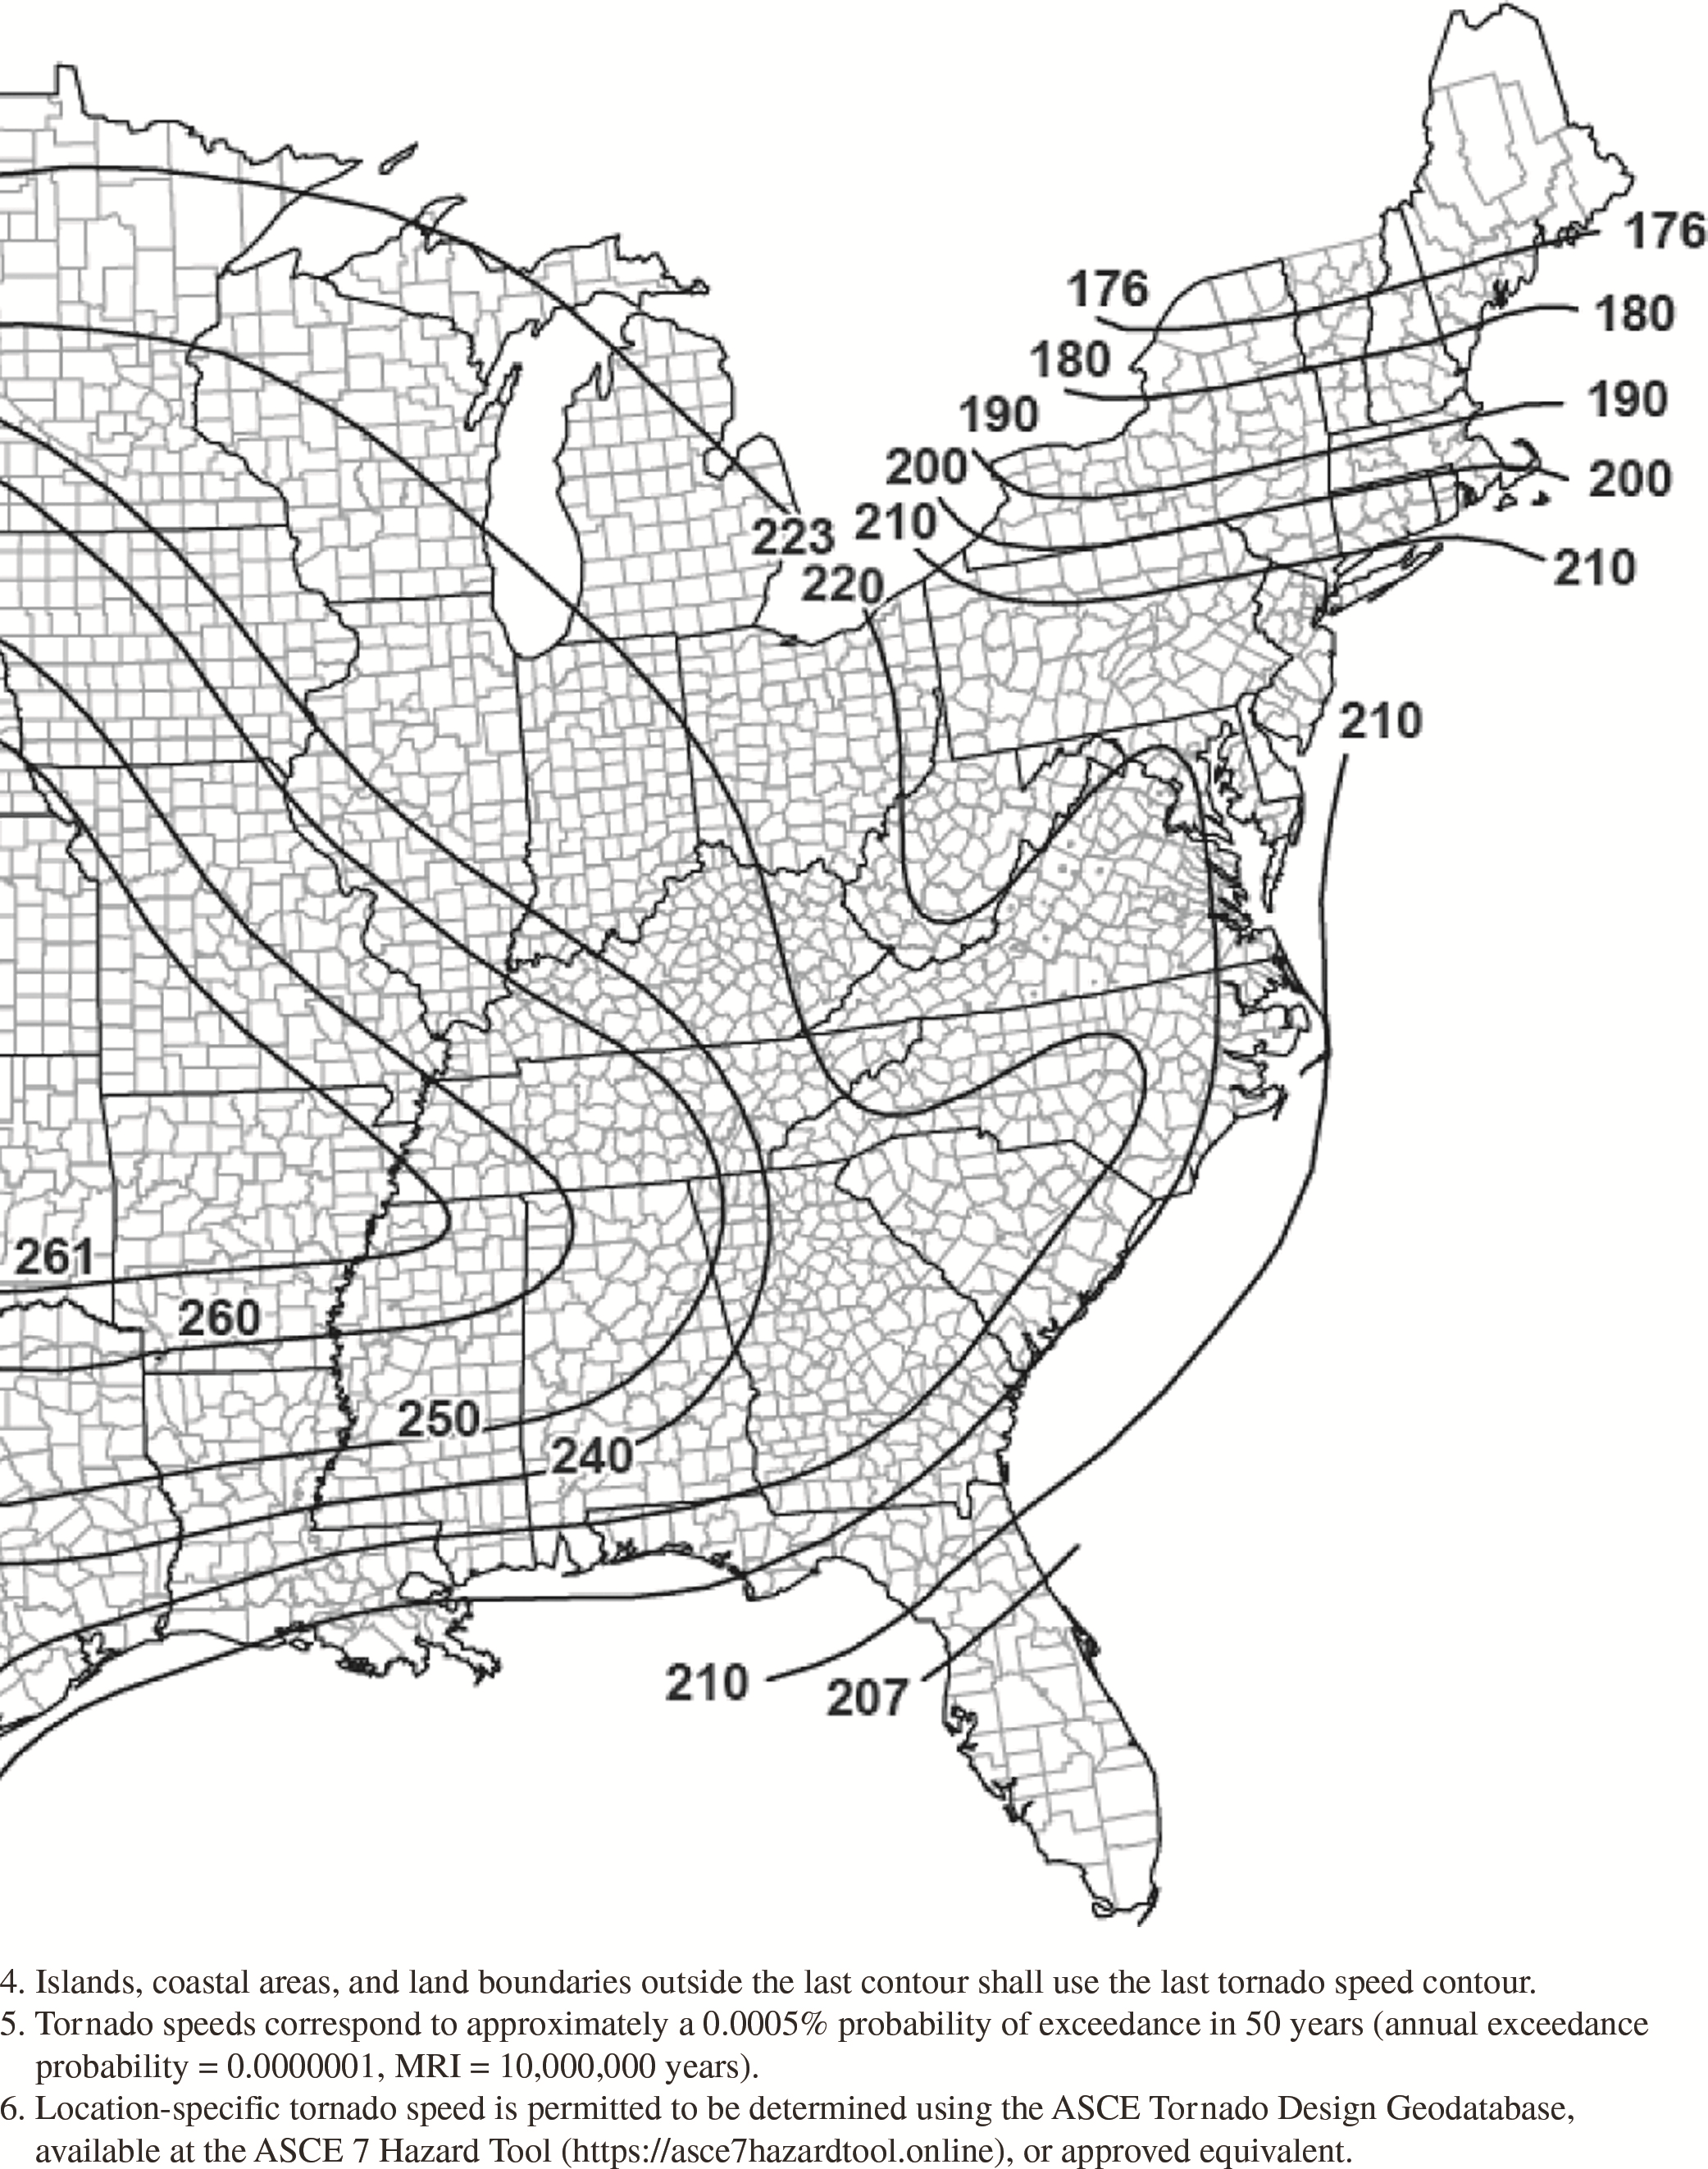
Figure G.2-4D. Tornado speeds for 10,000,000-year MRI for
effective plan area of 40,000
ft2
(3,716 m2).
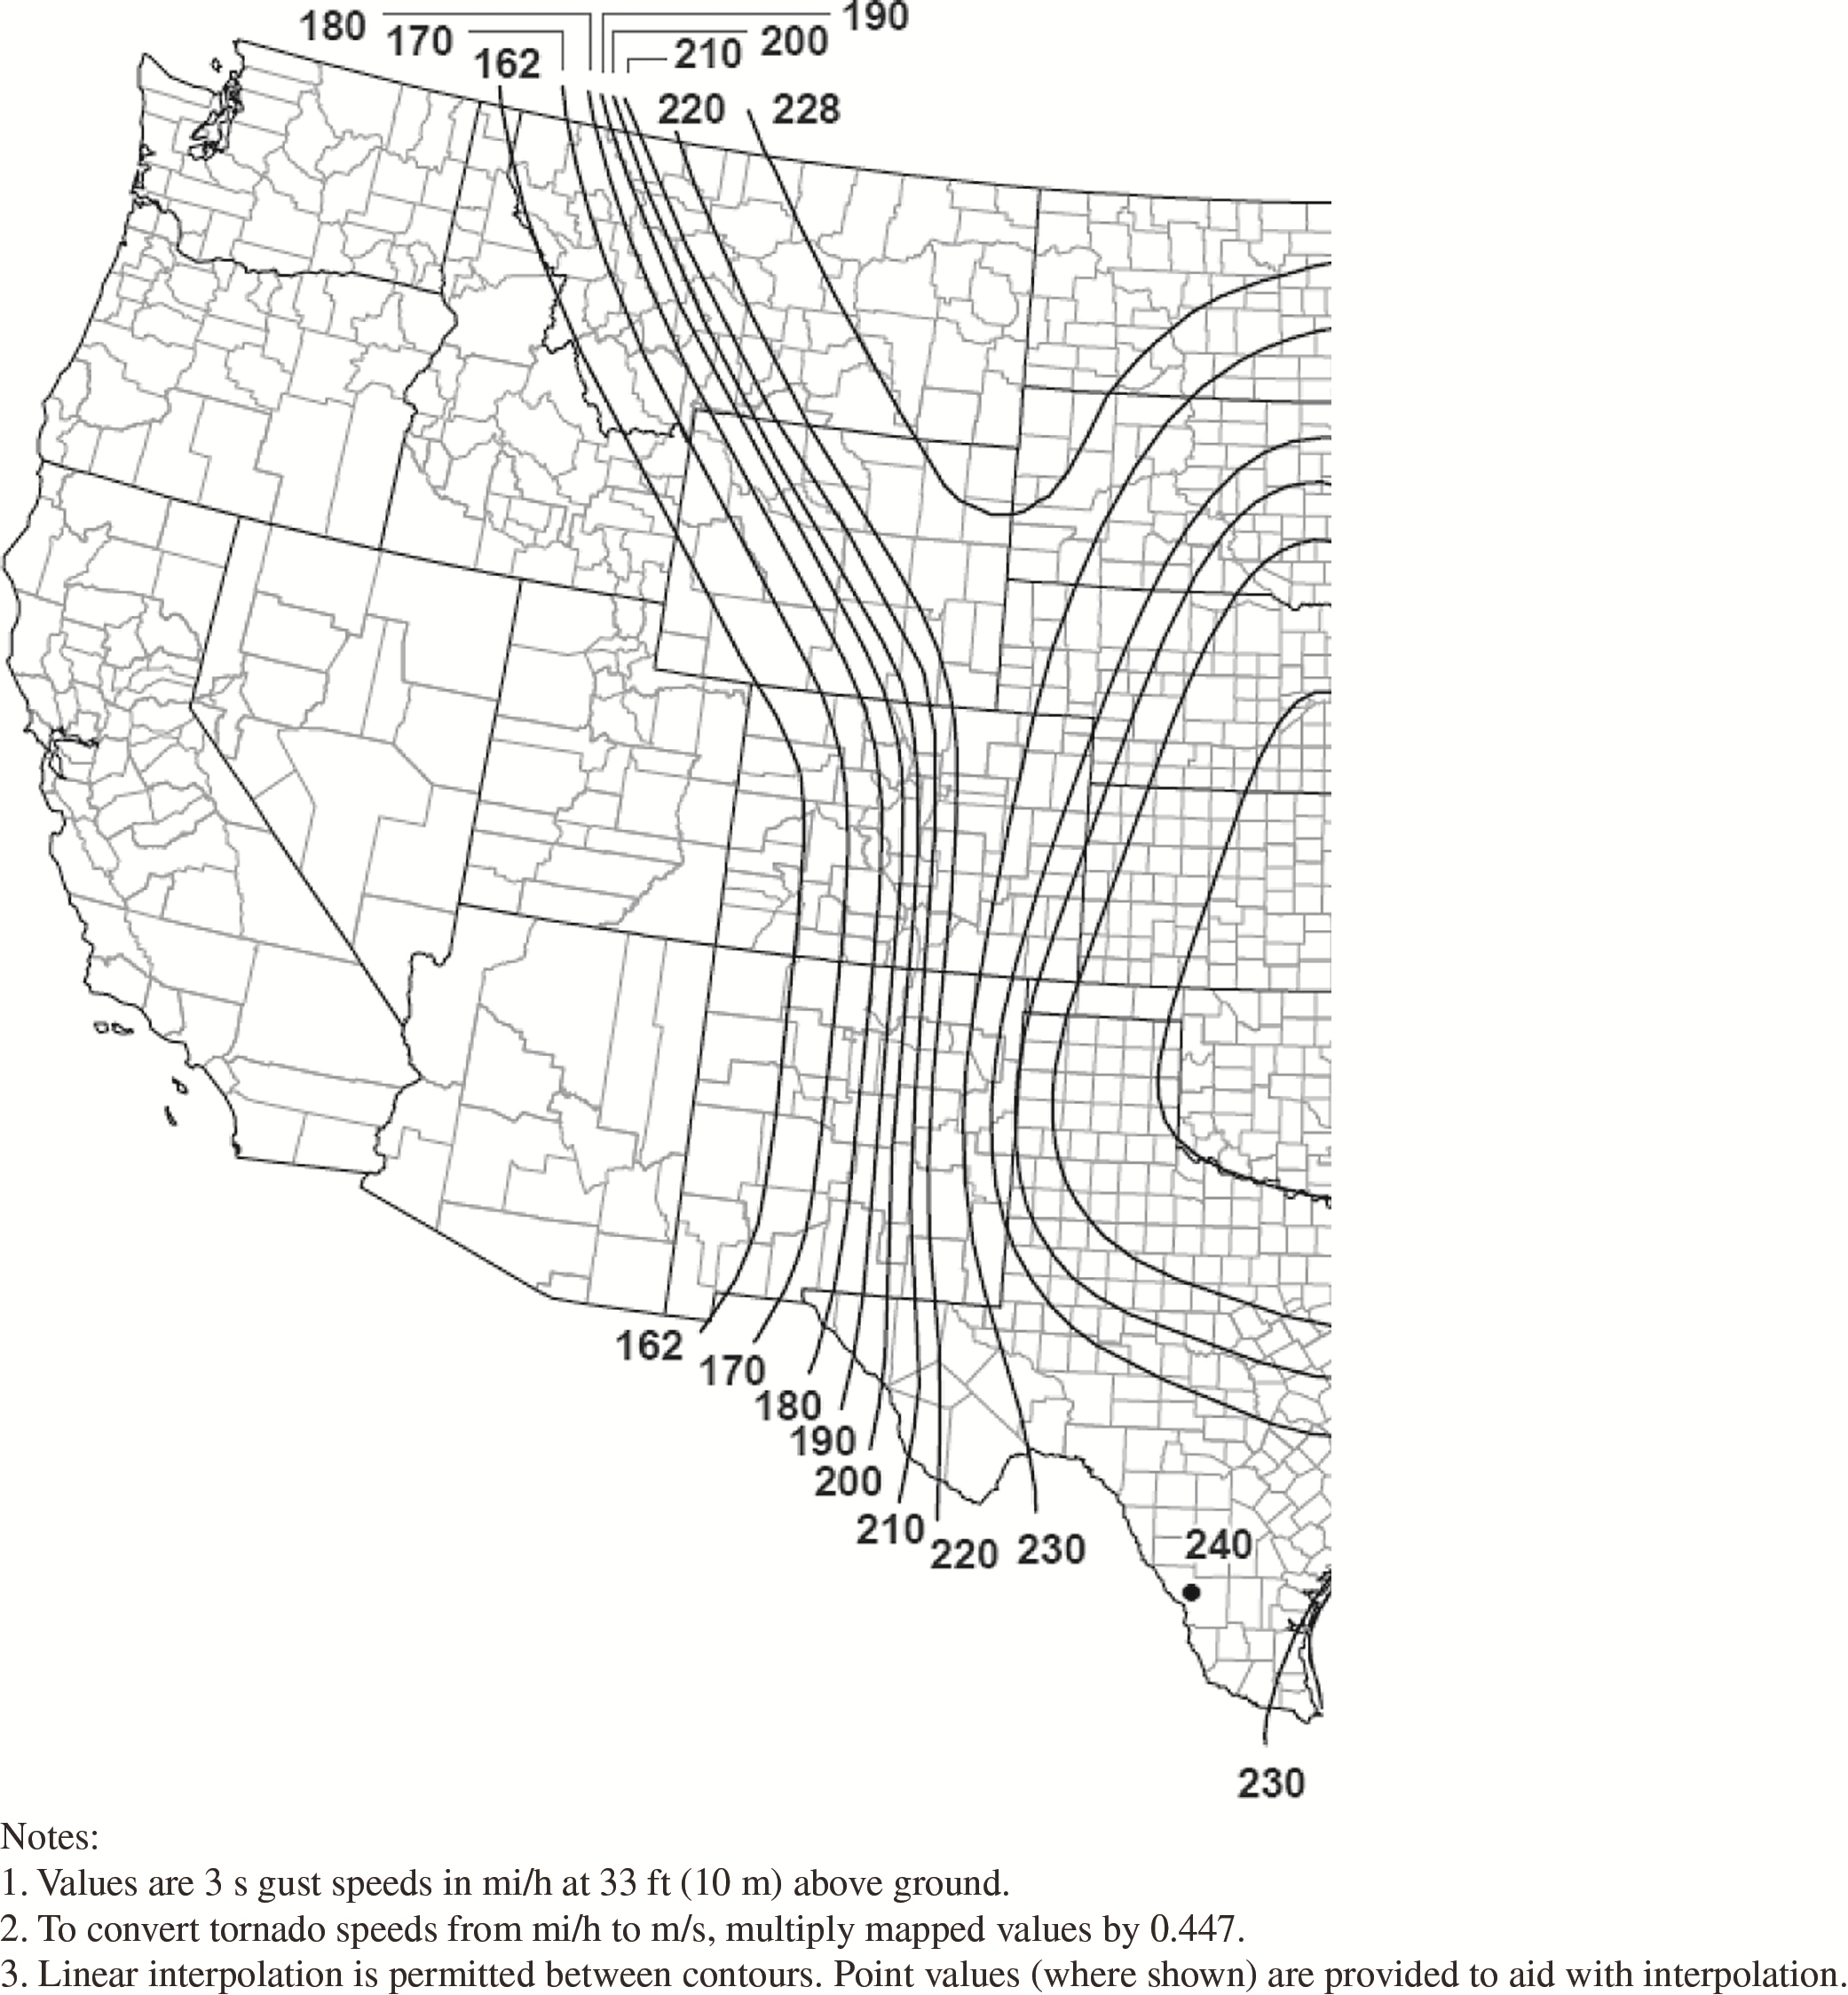
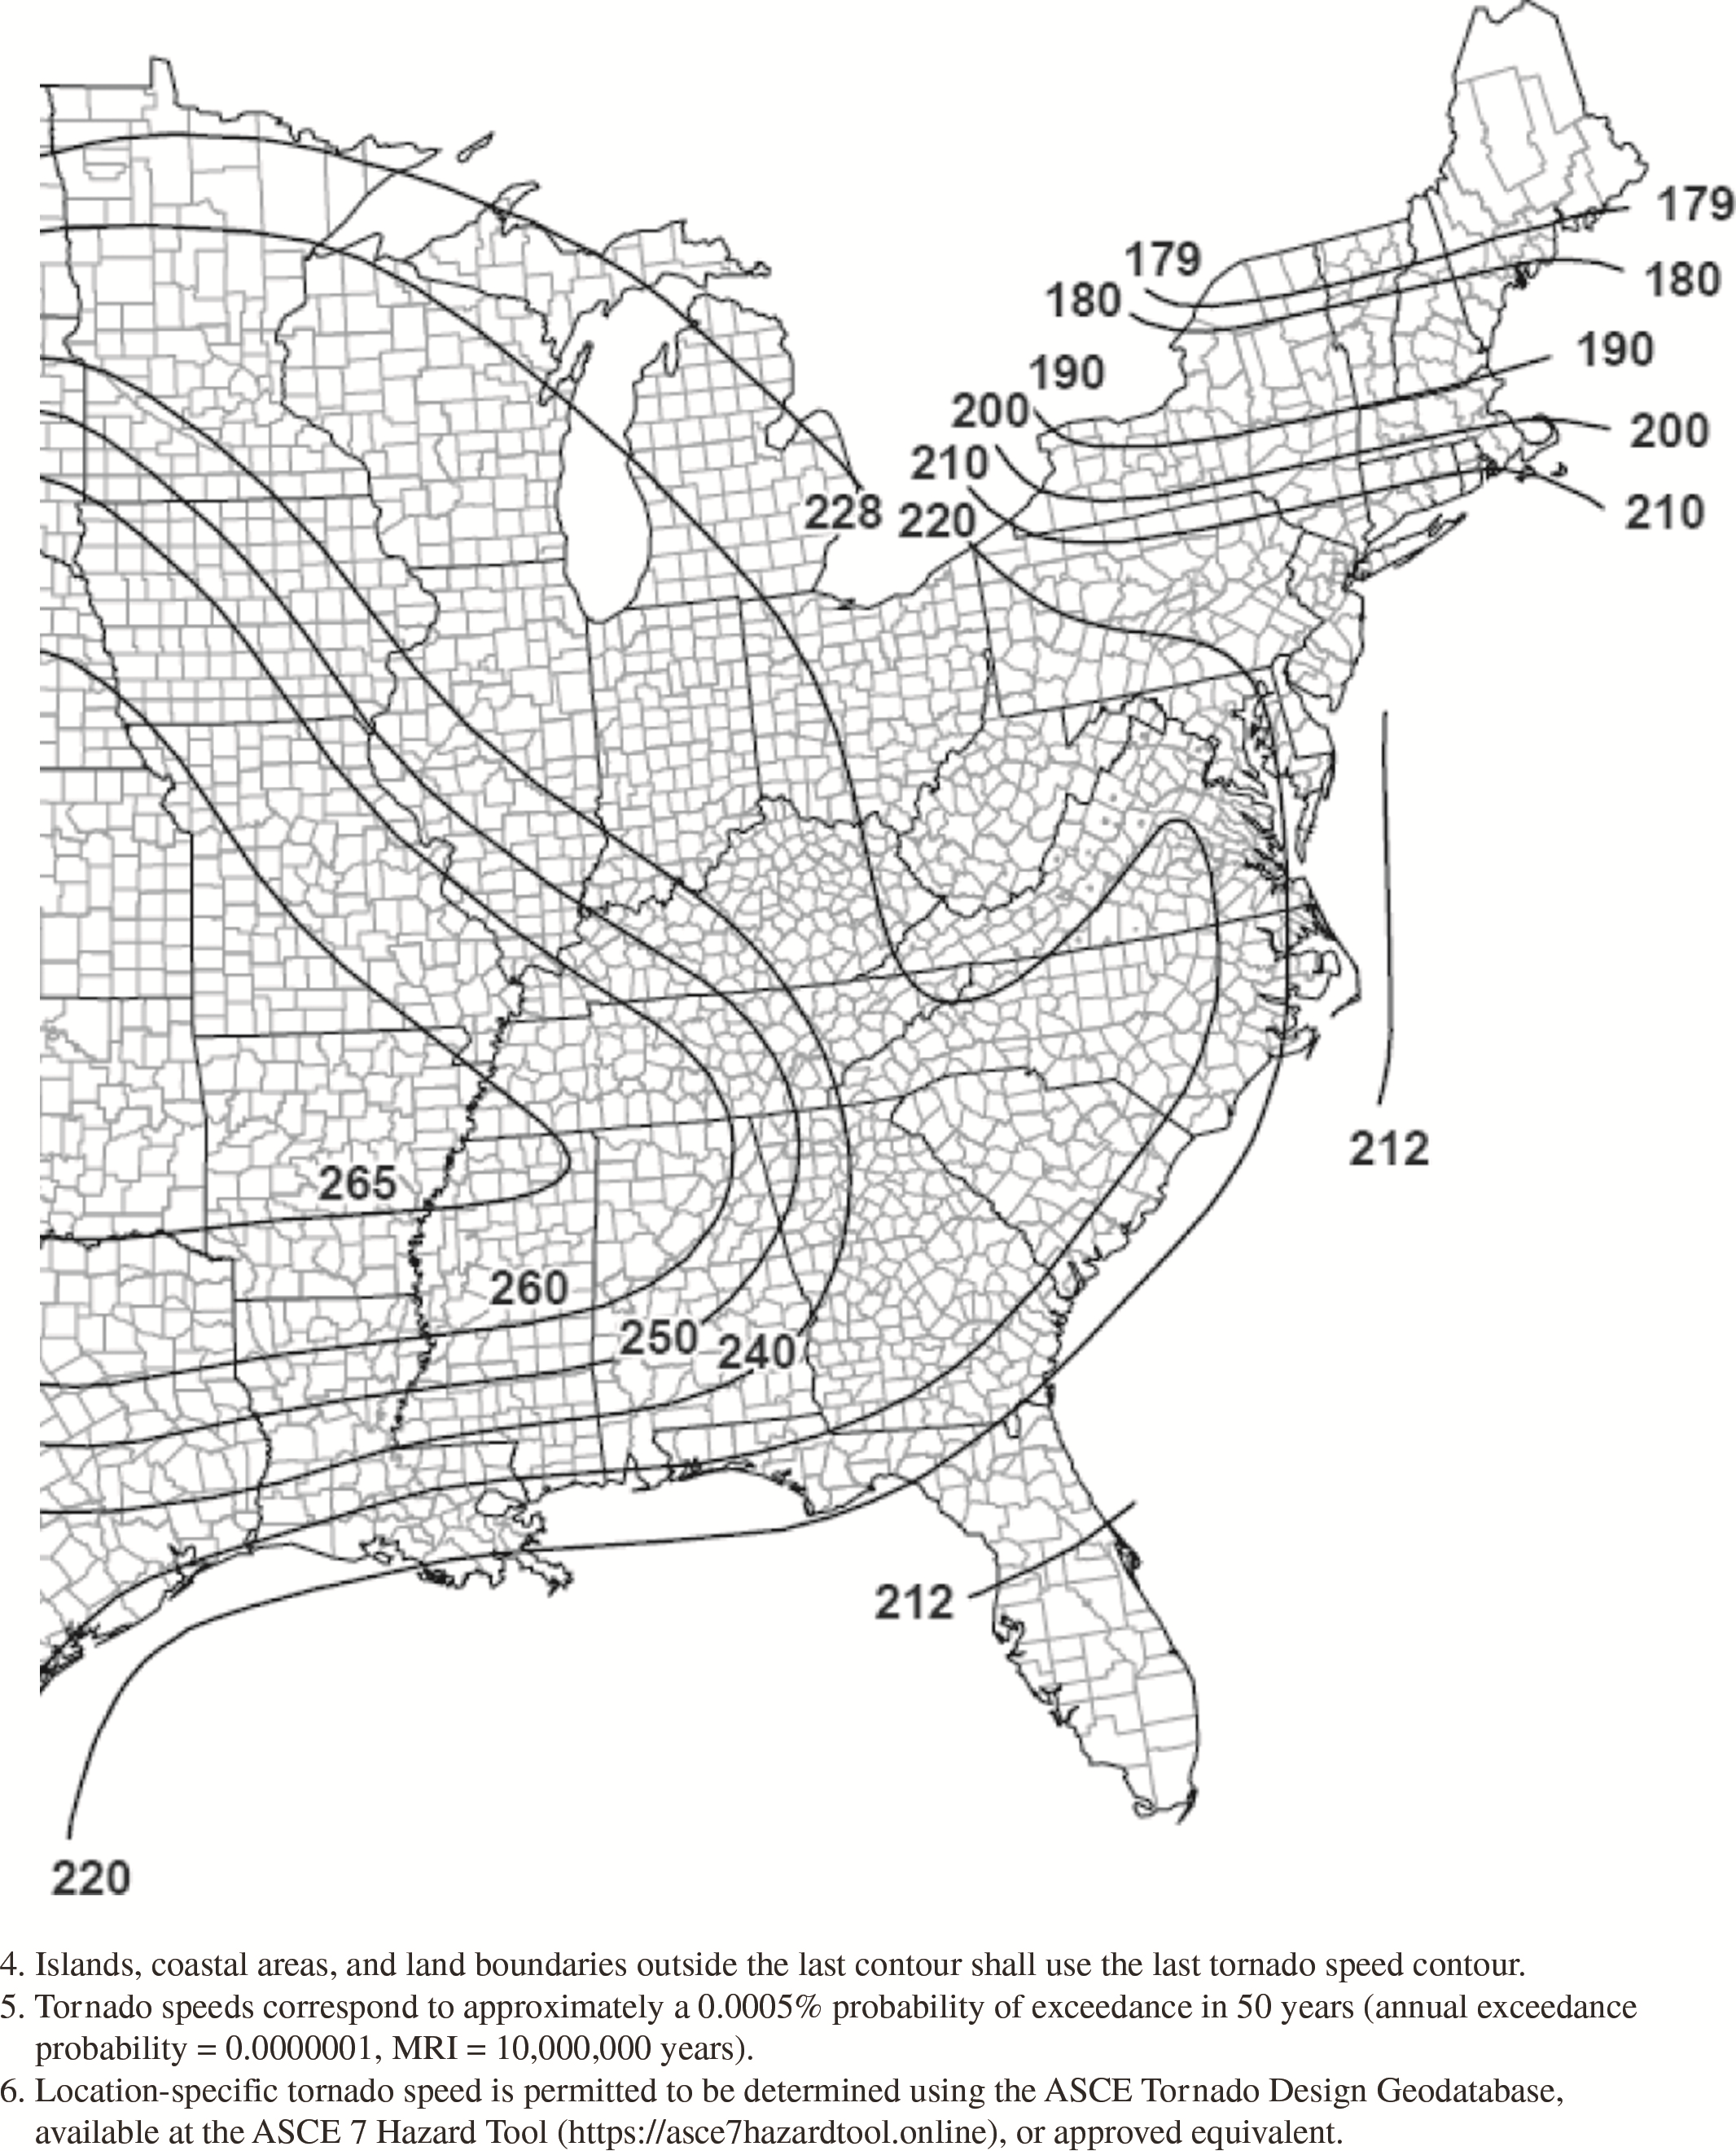
Figure G.2-4E. Tornado speeds for 10,000,000-year MRI for
effective plan area of 100,000
ft2
(9,290 m2).
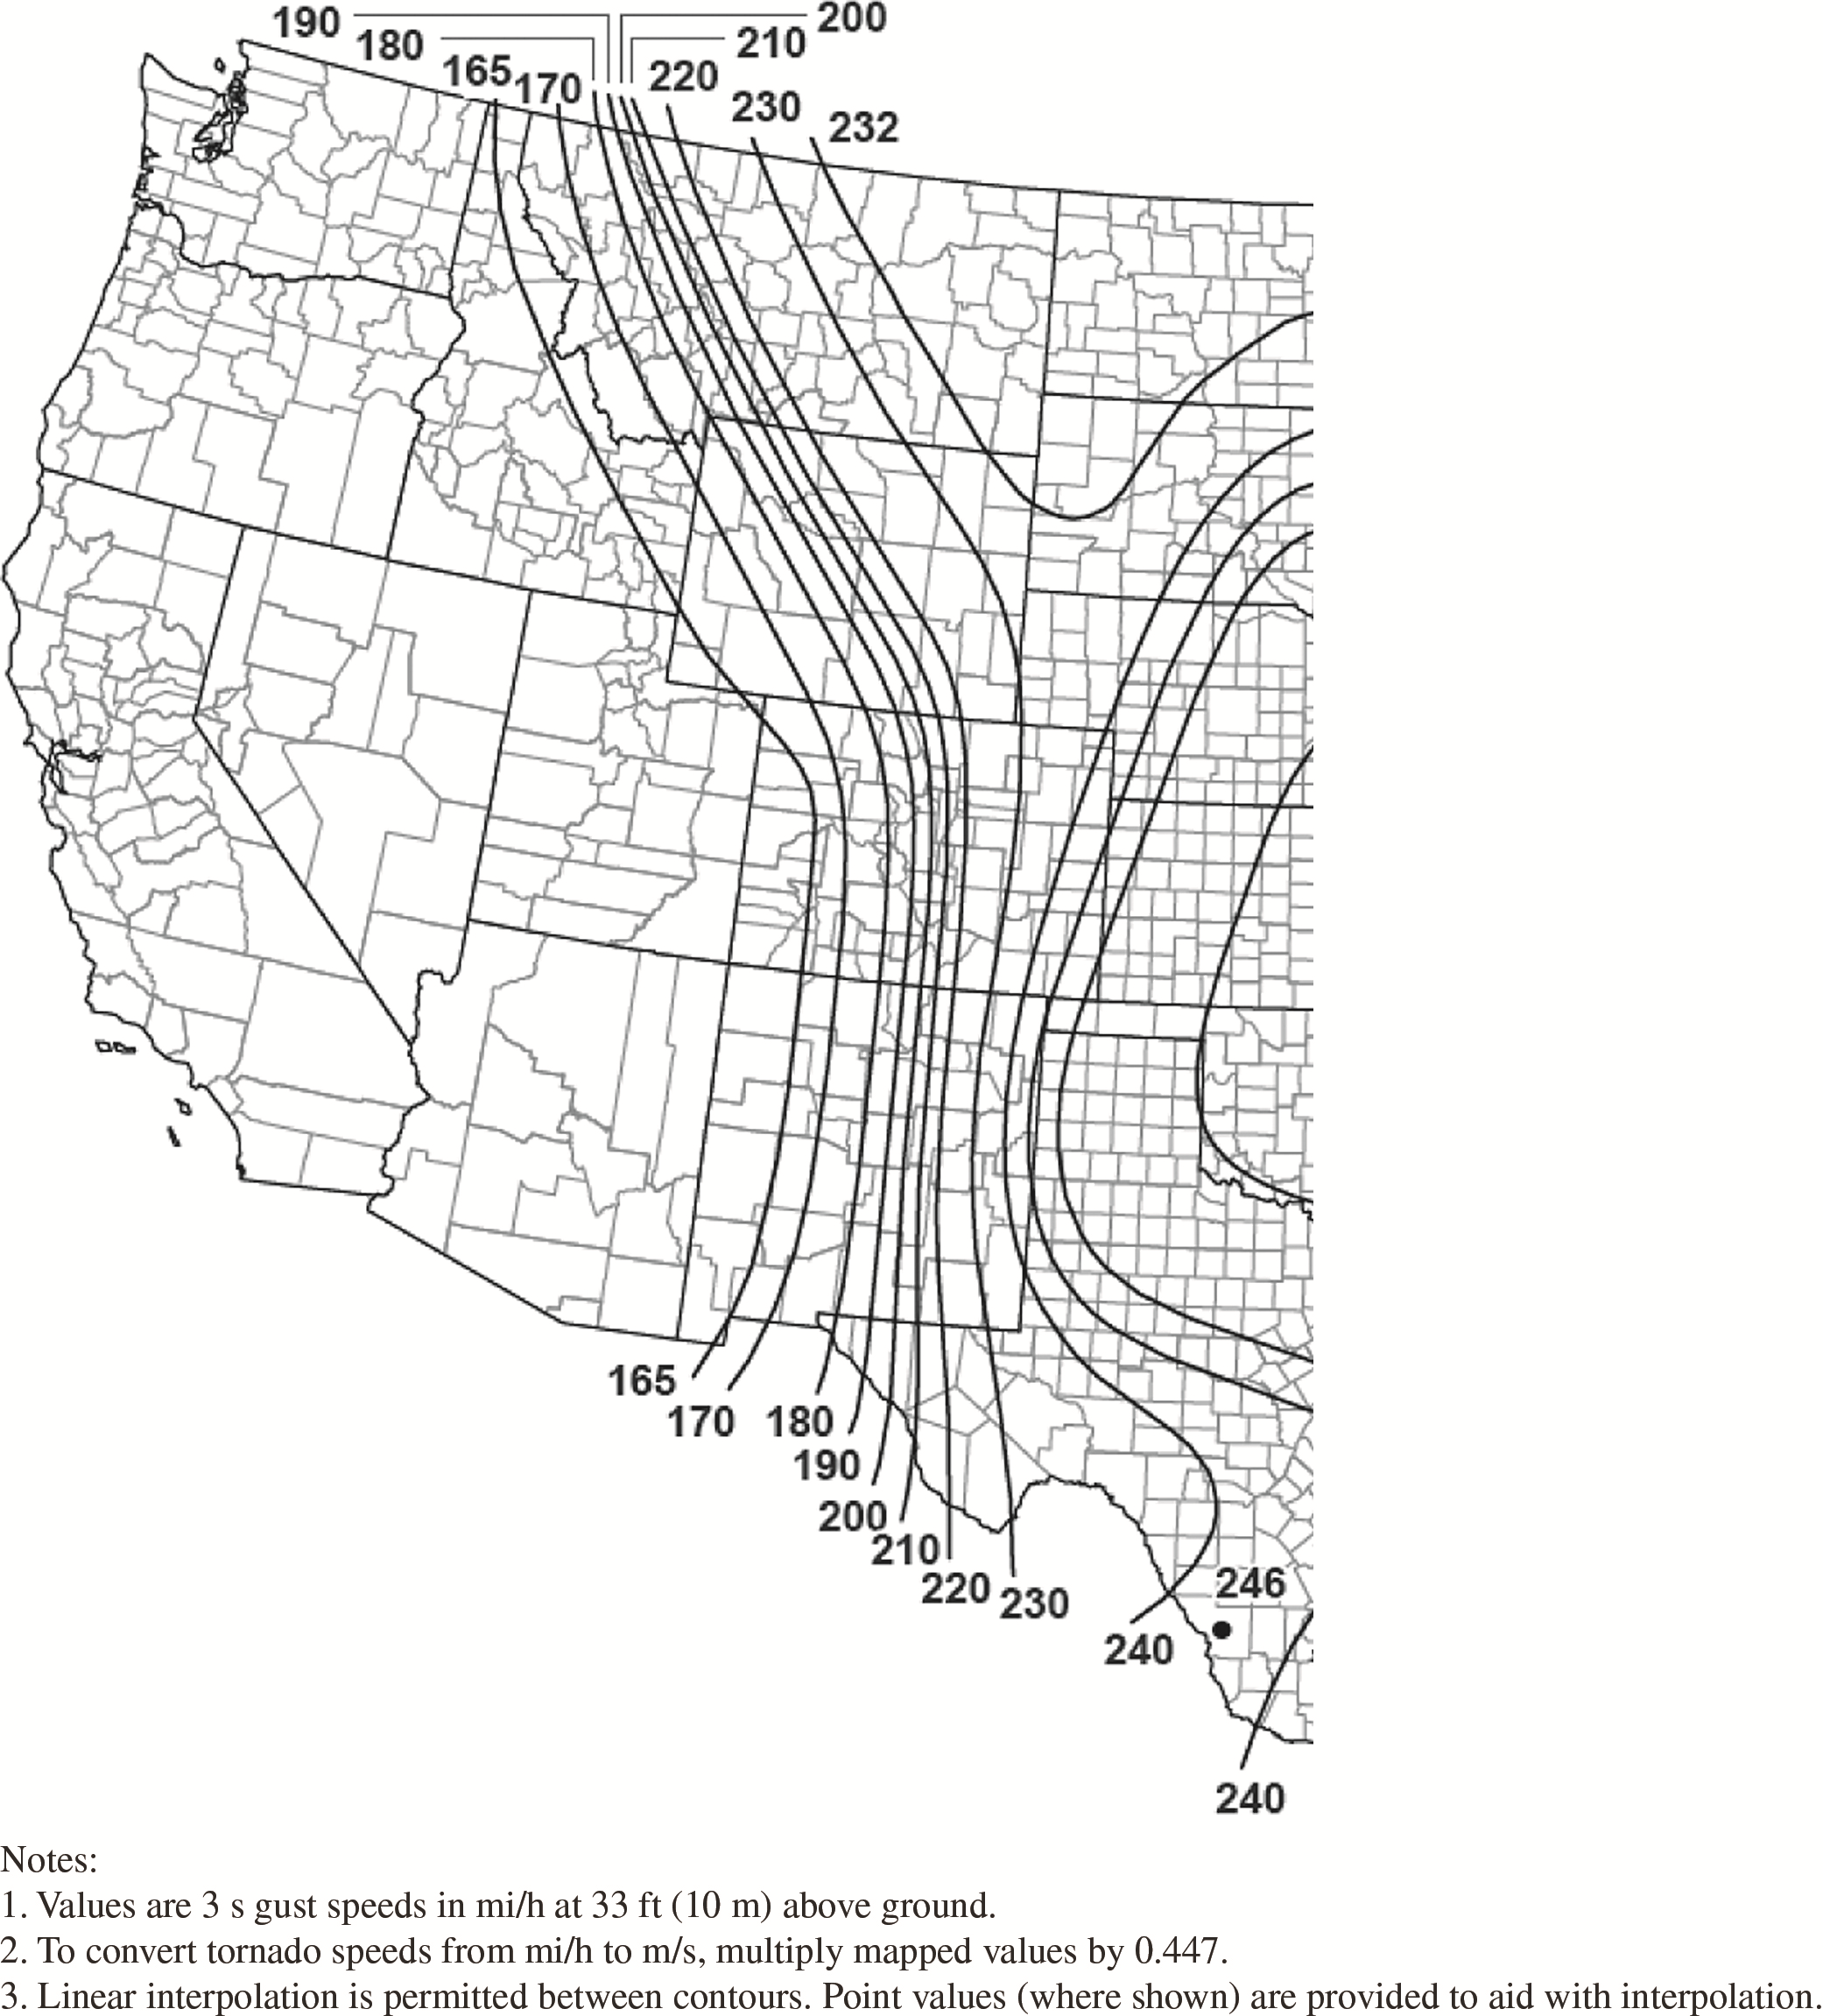
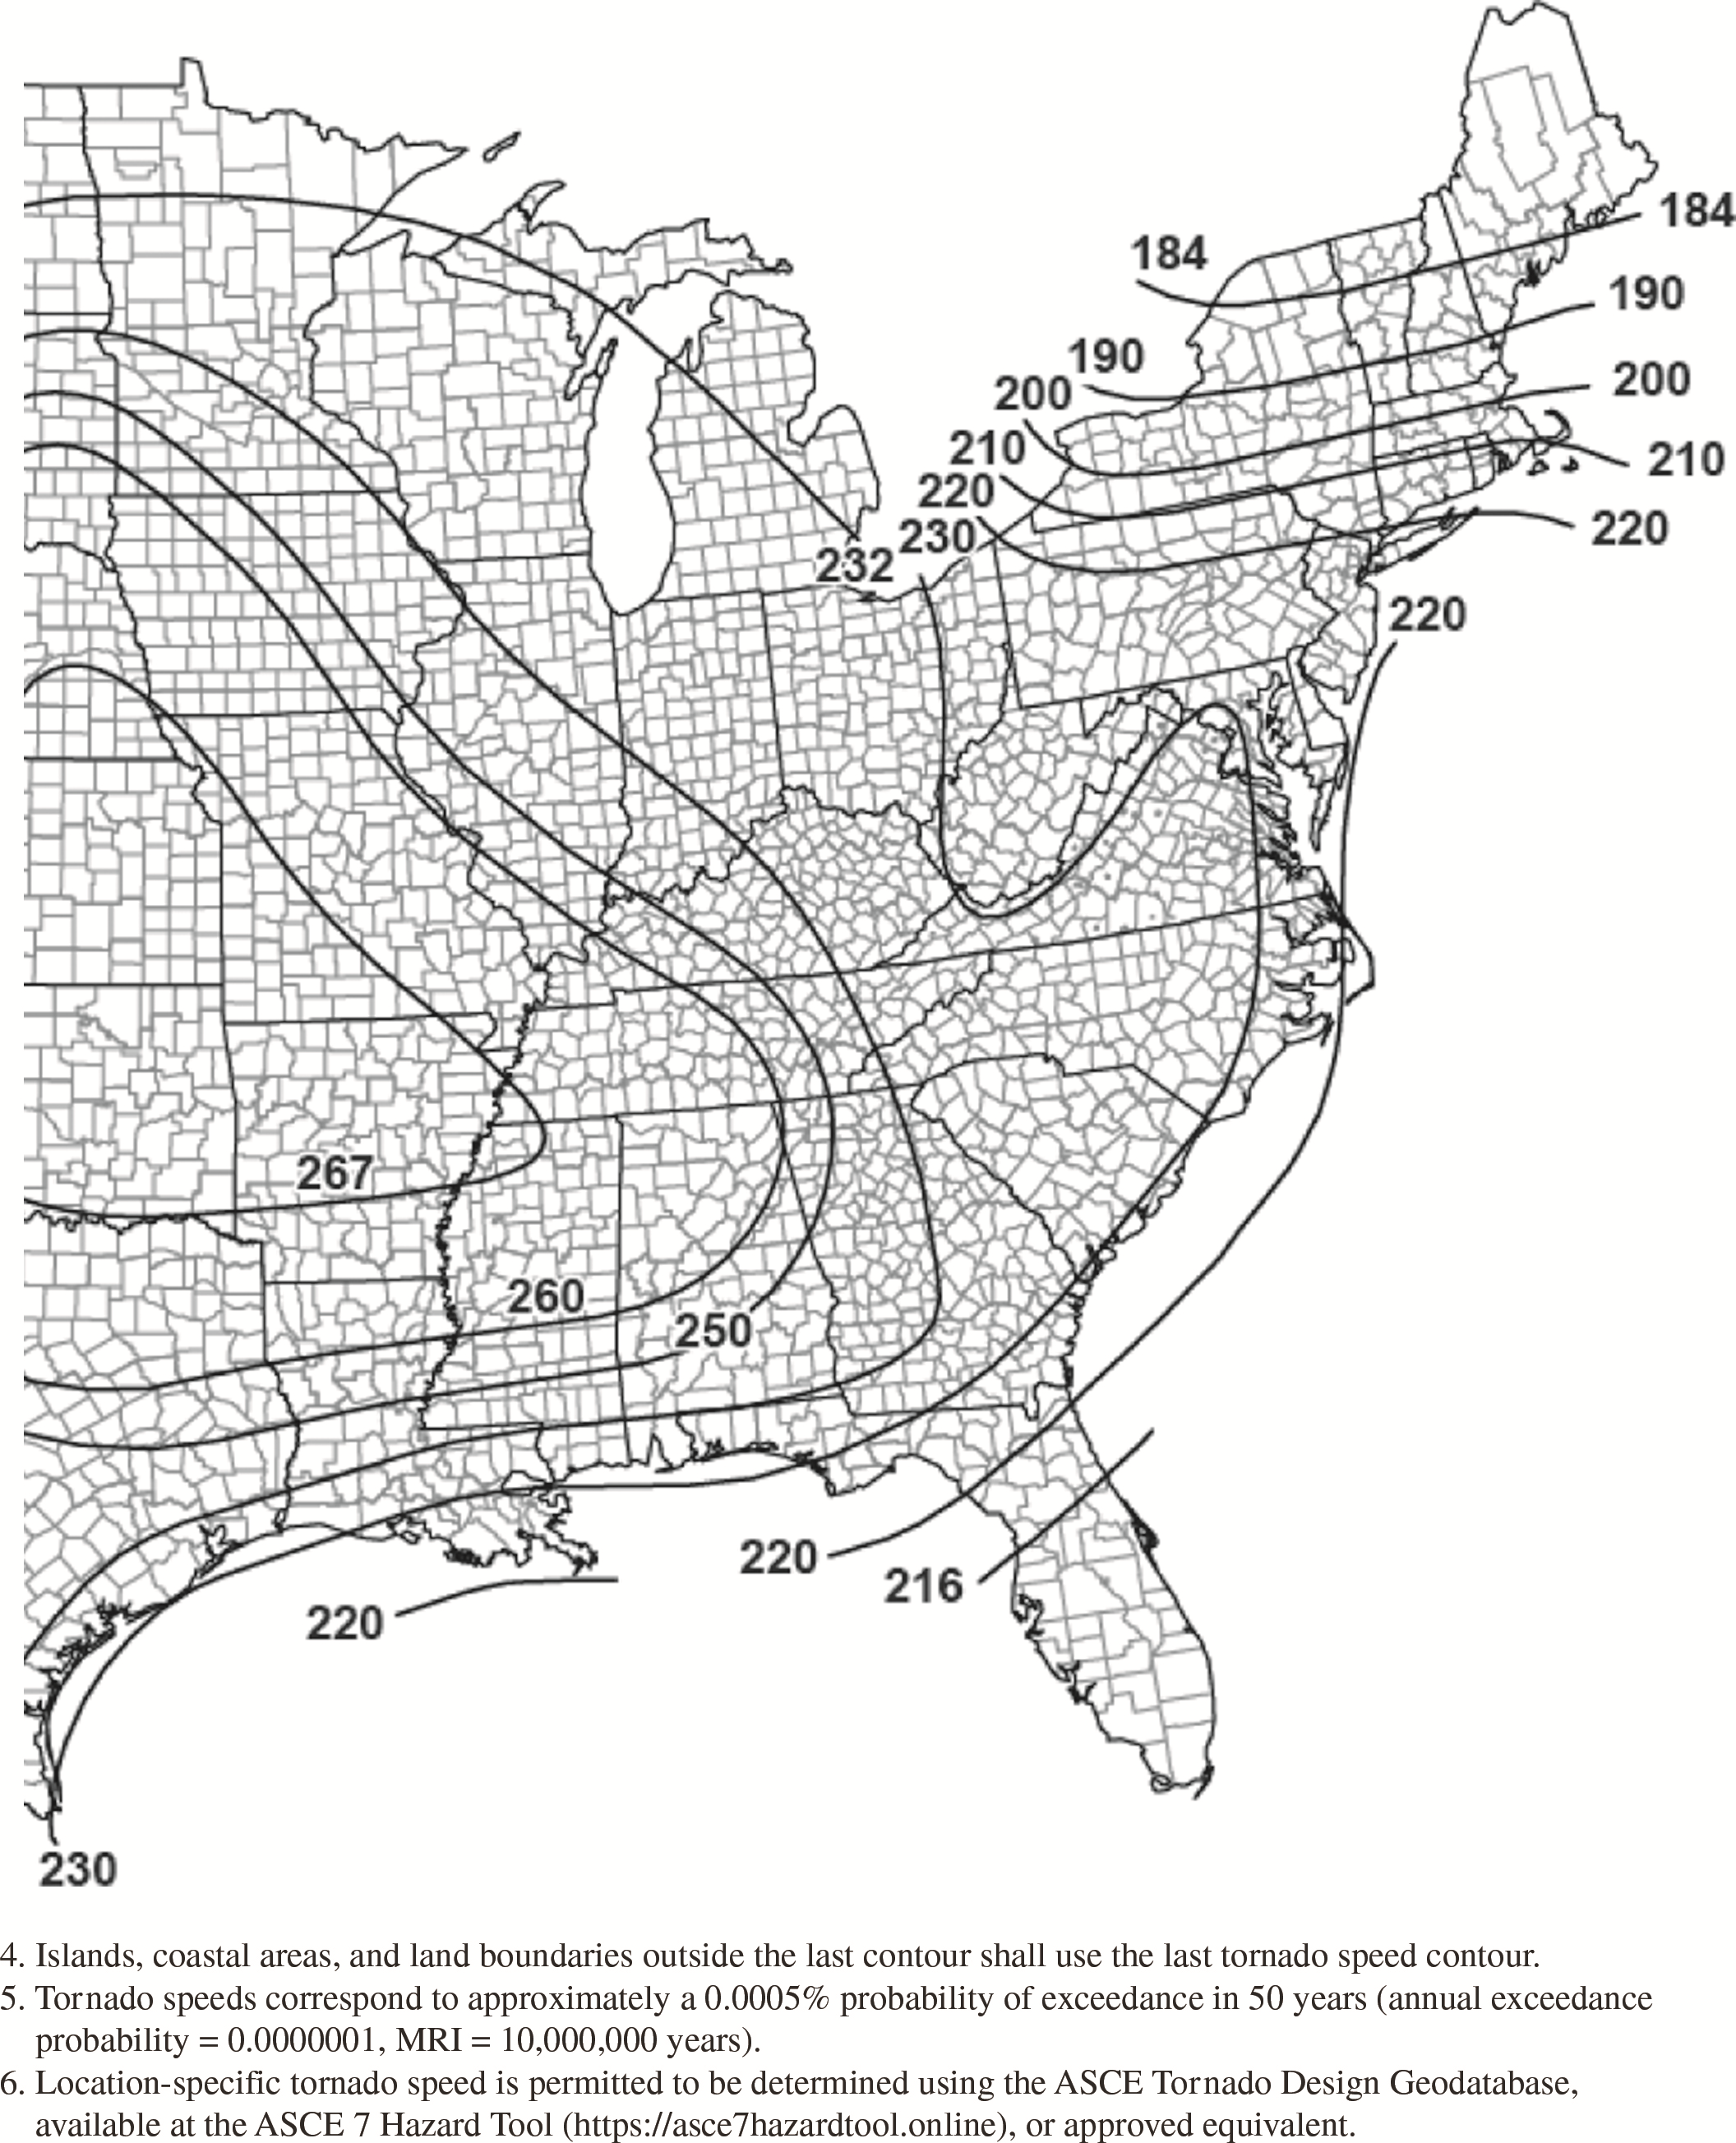
Figure G.2-4F. Tornado speeds for 10,000,000-year MRI for
effective plan area of 250,000
ft2
(23,226
m2).
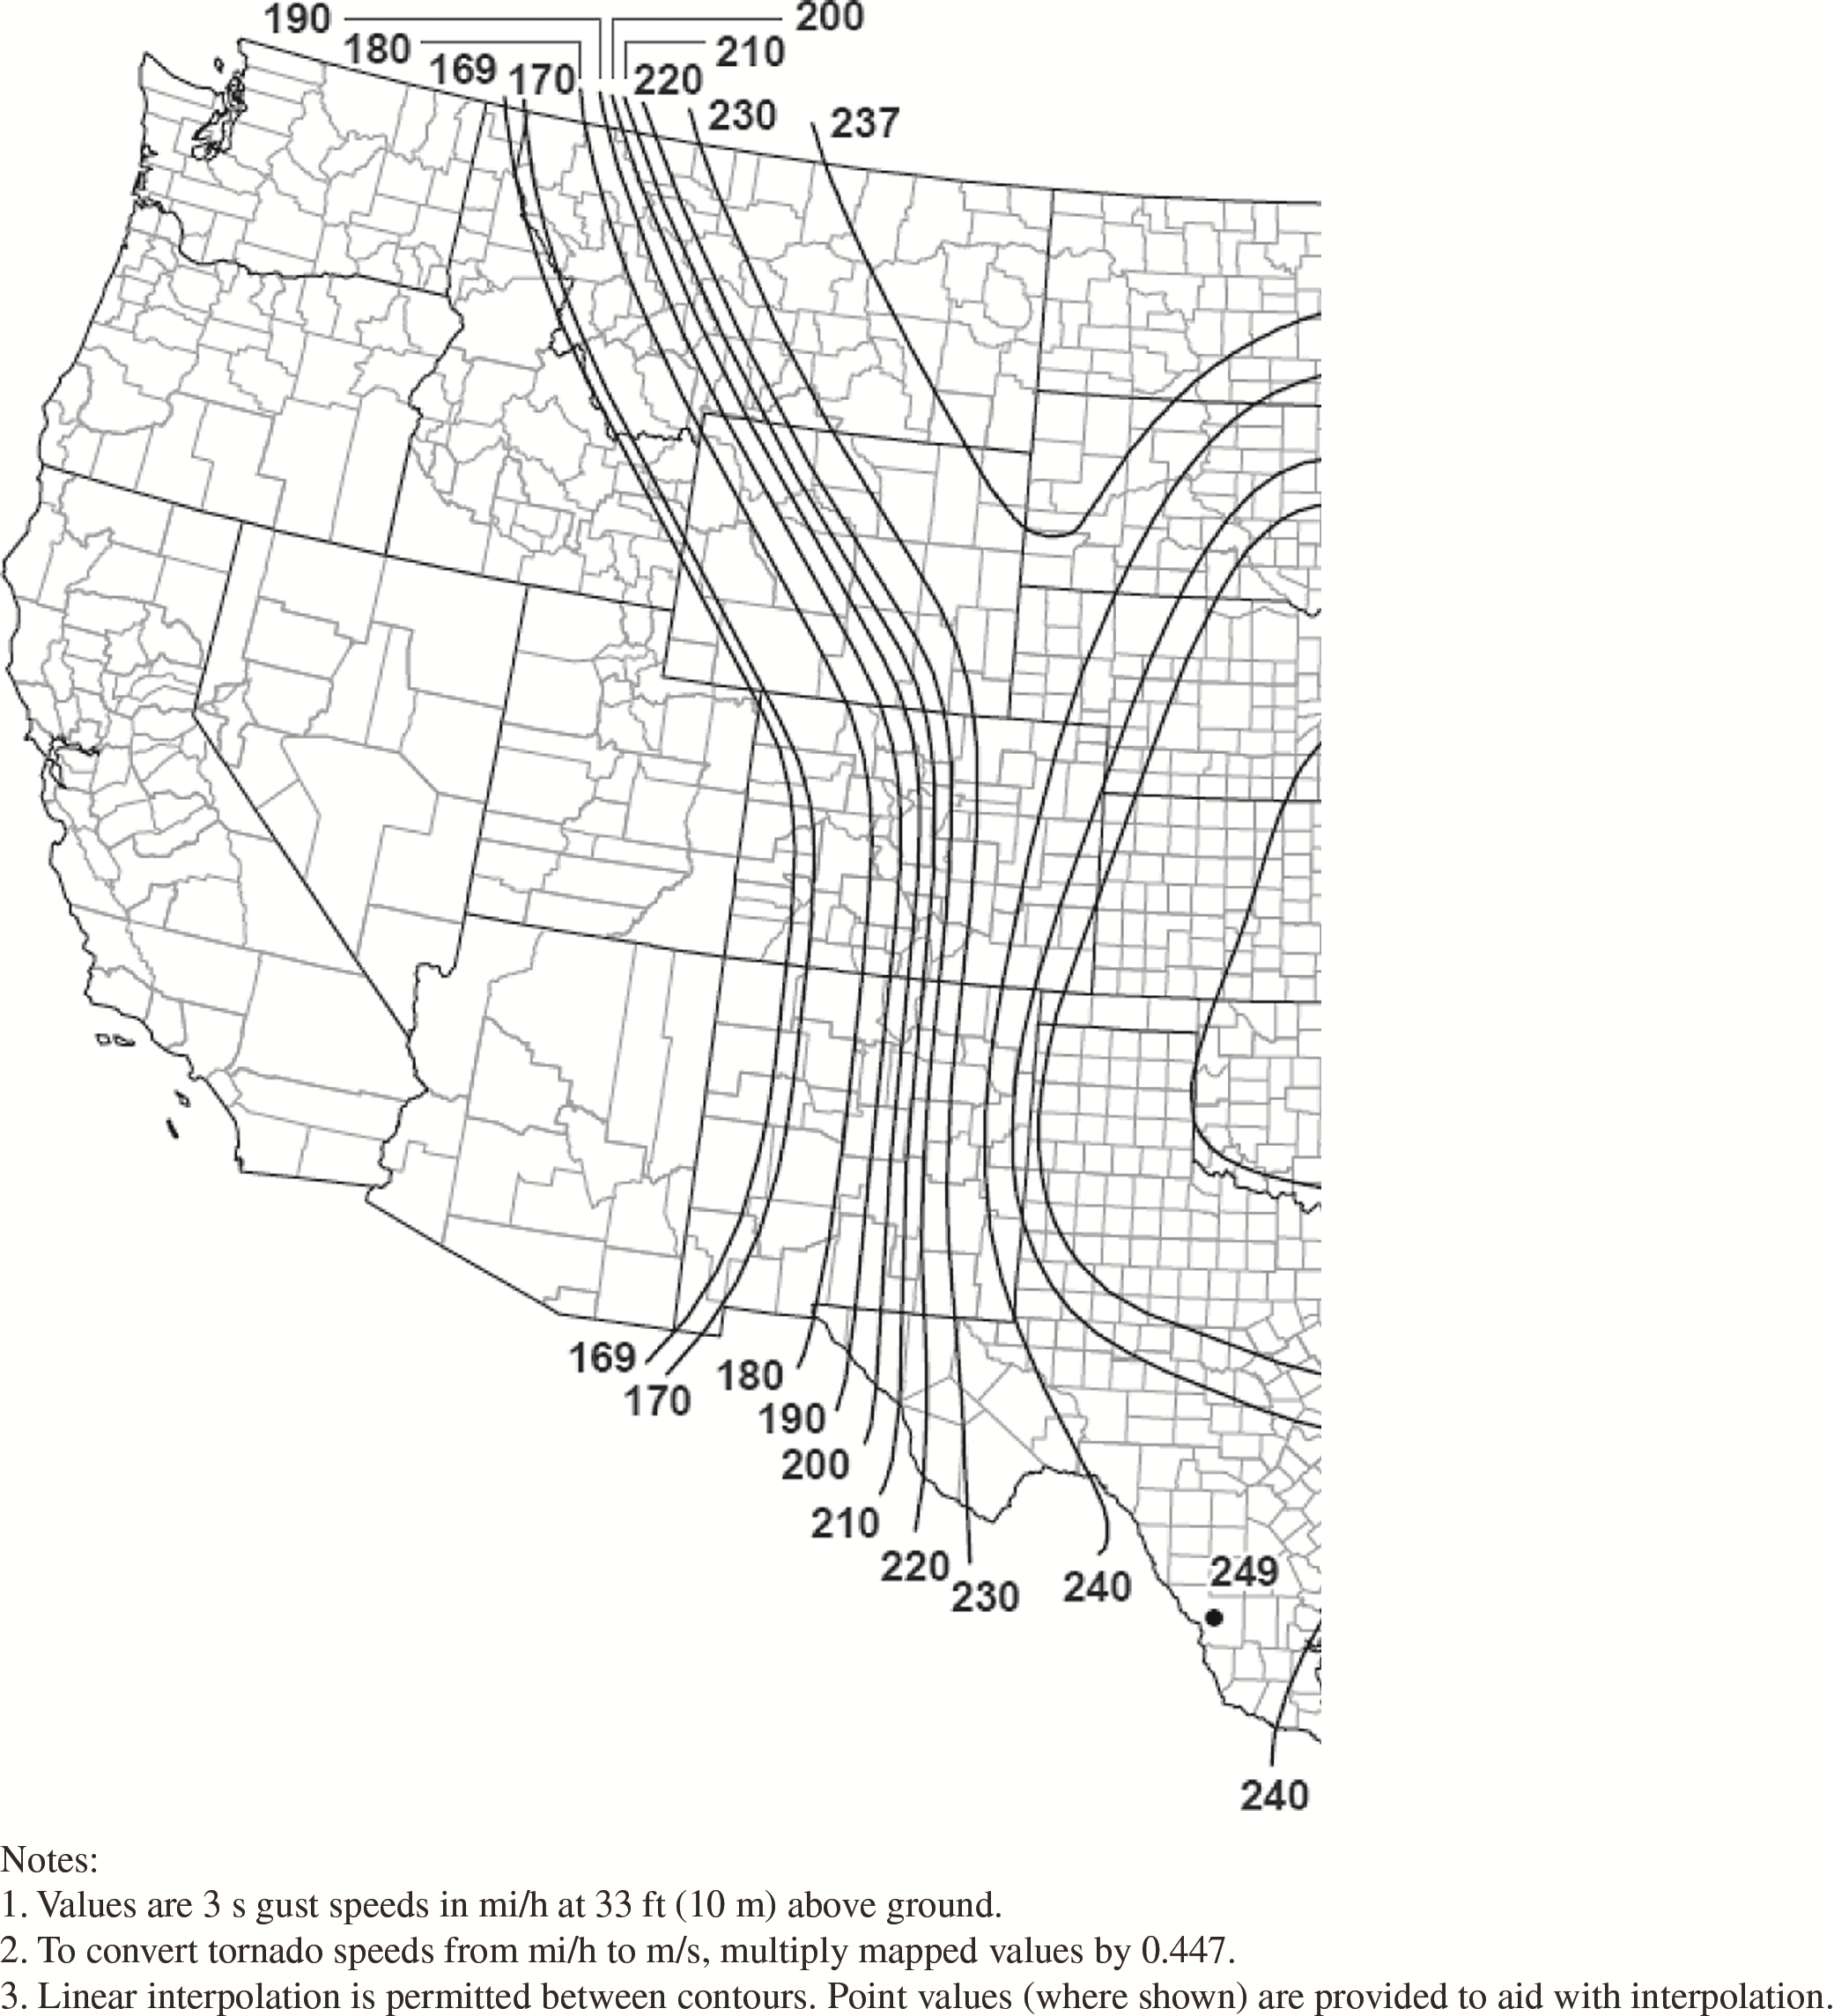
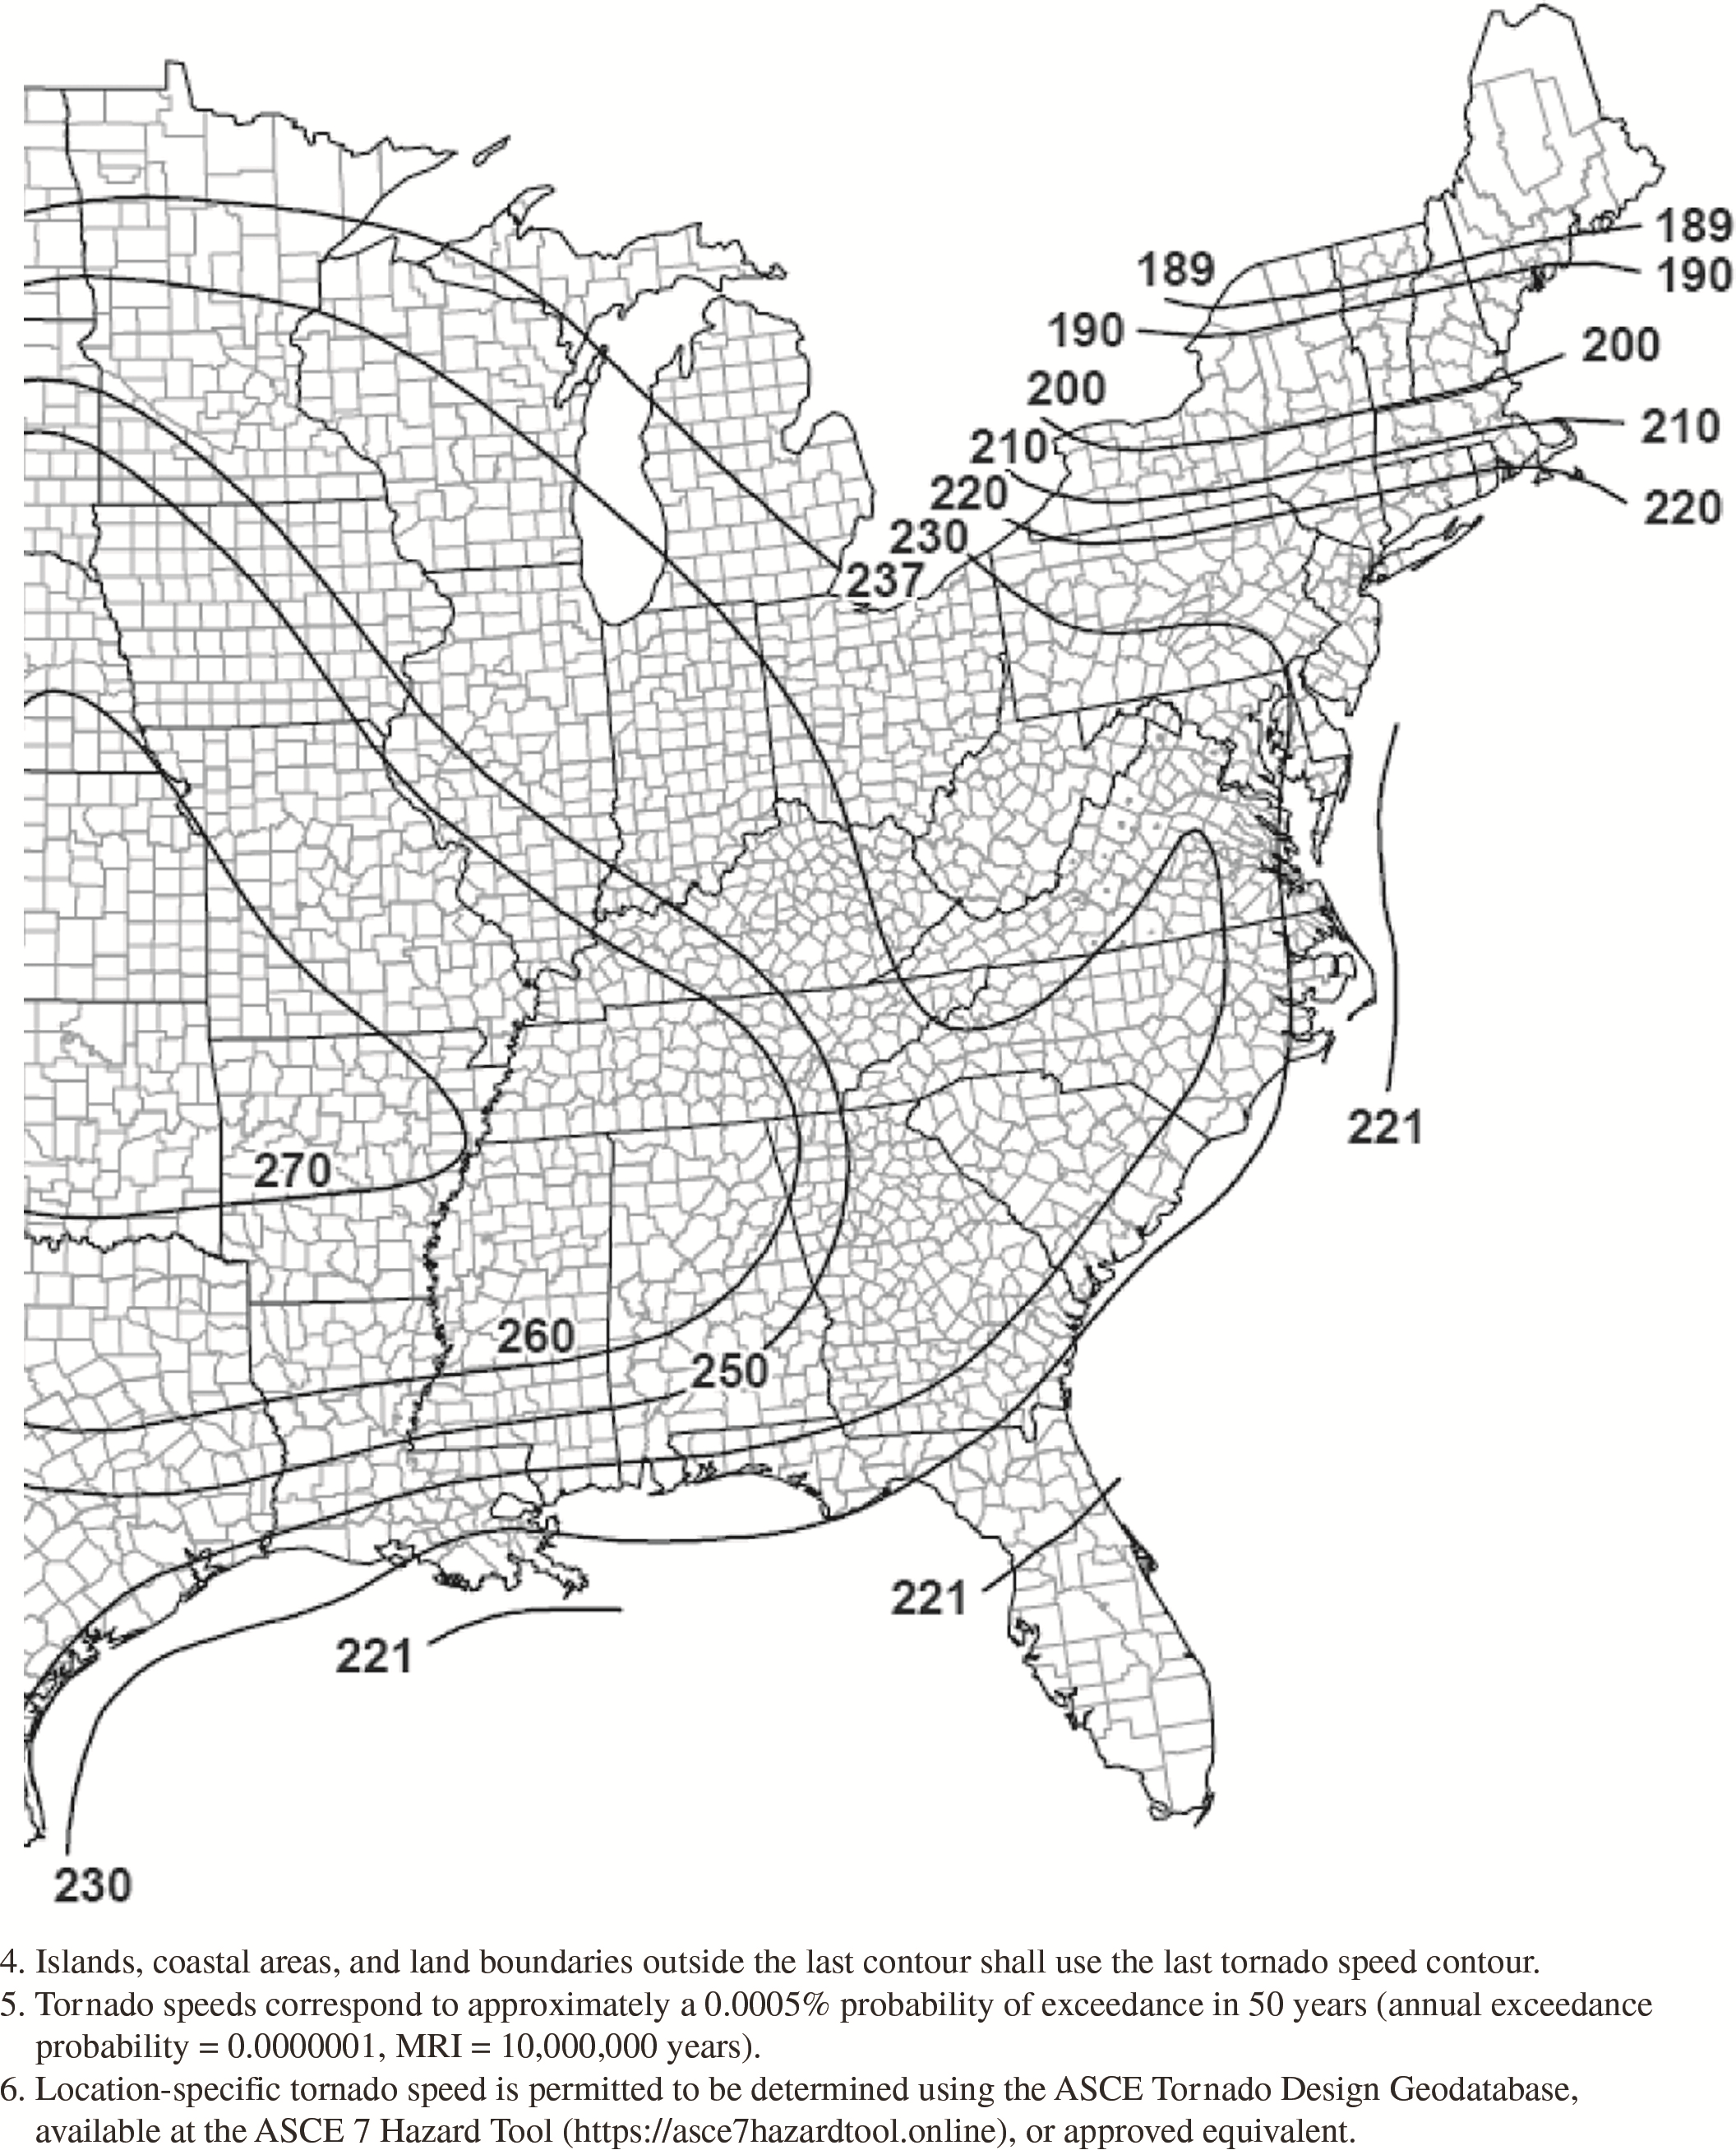
Figure G.2-4G. Tornado speeds for 10,000,000-year MRI for
effective plan area of 1,000,000
ft2
(92,903
m2).
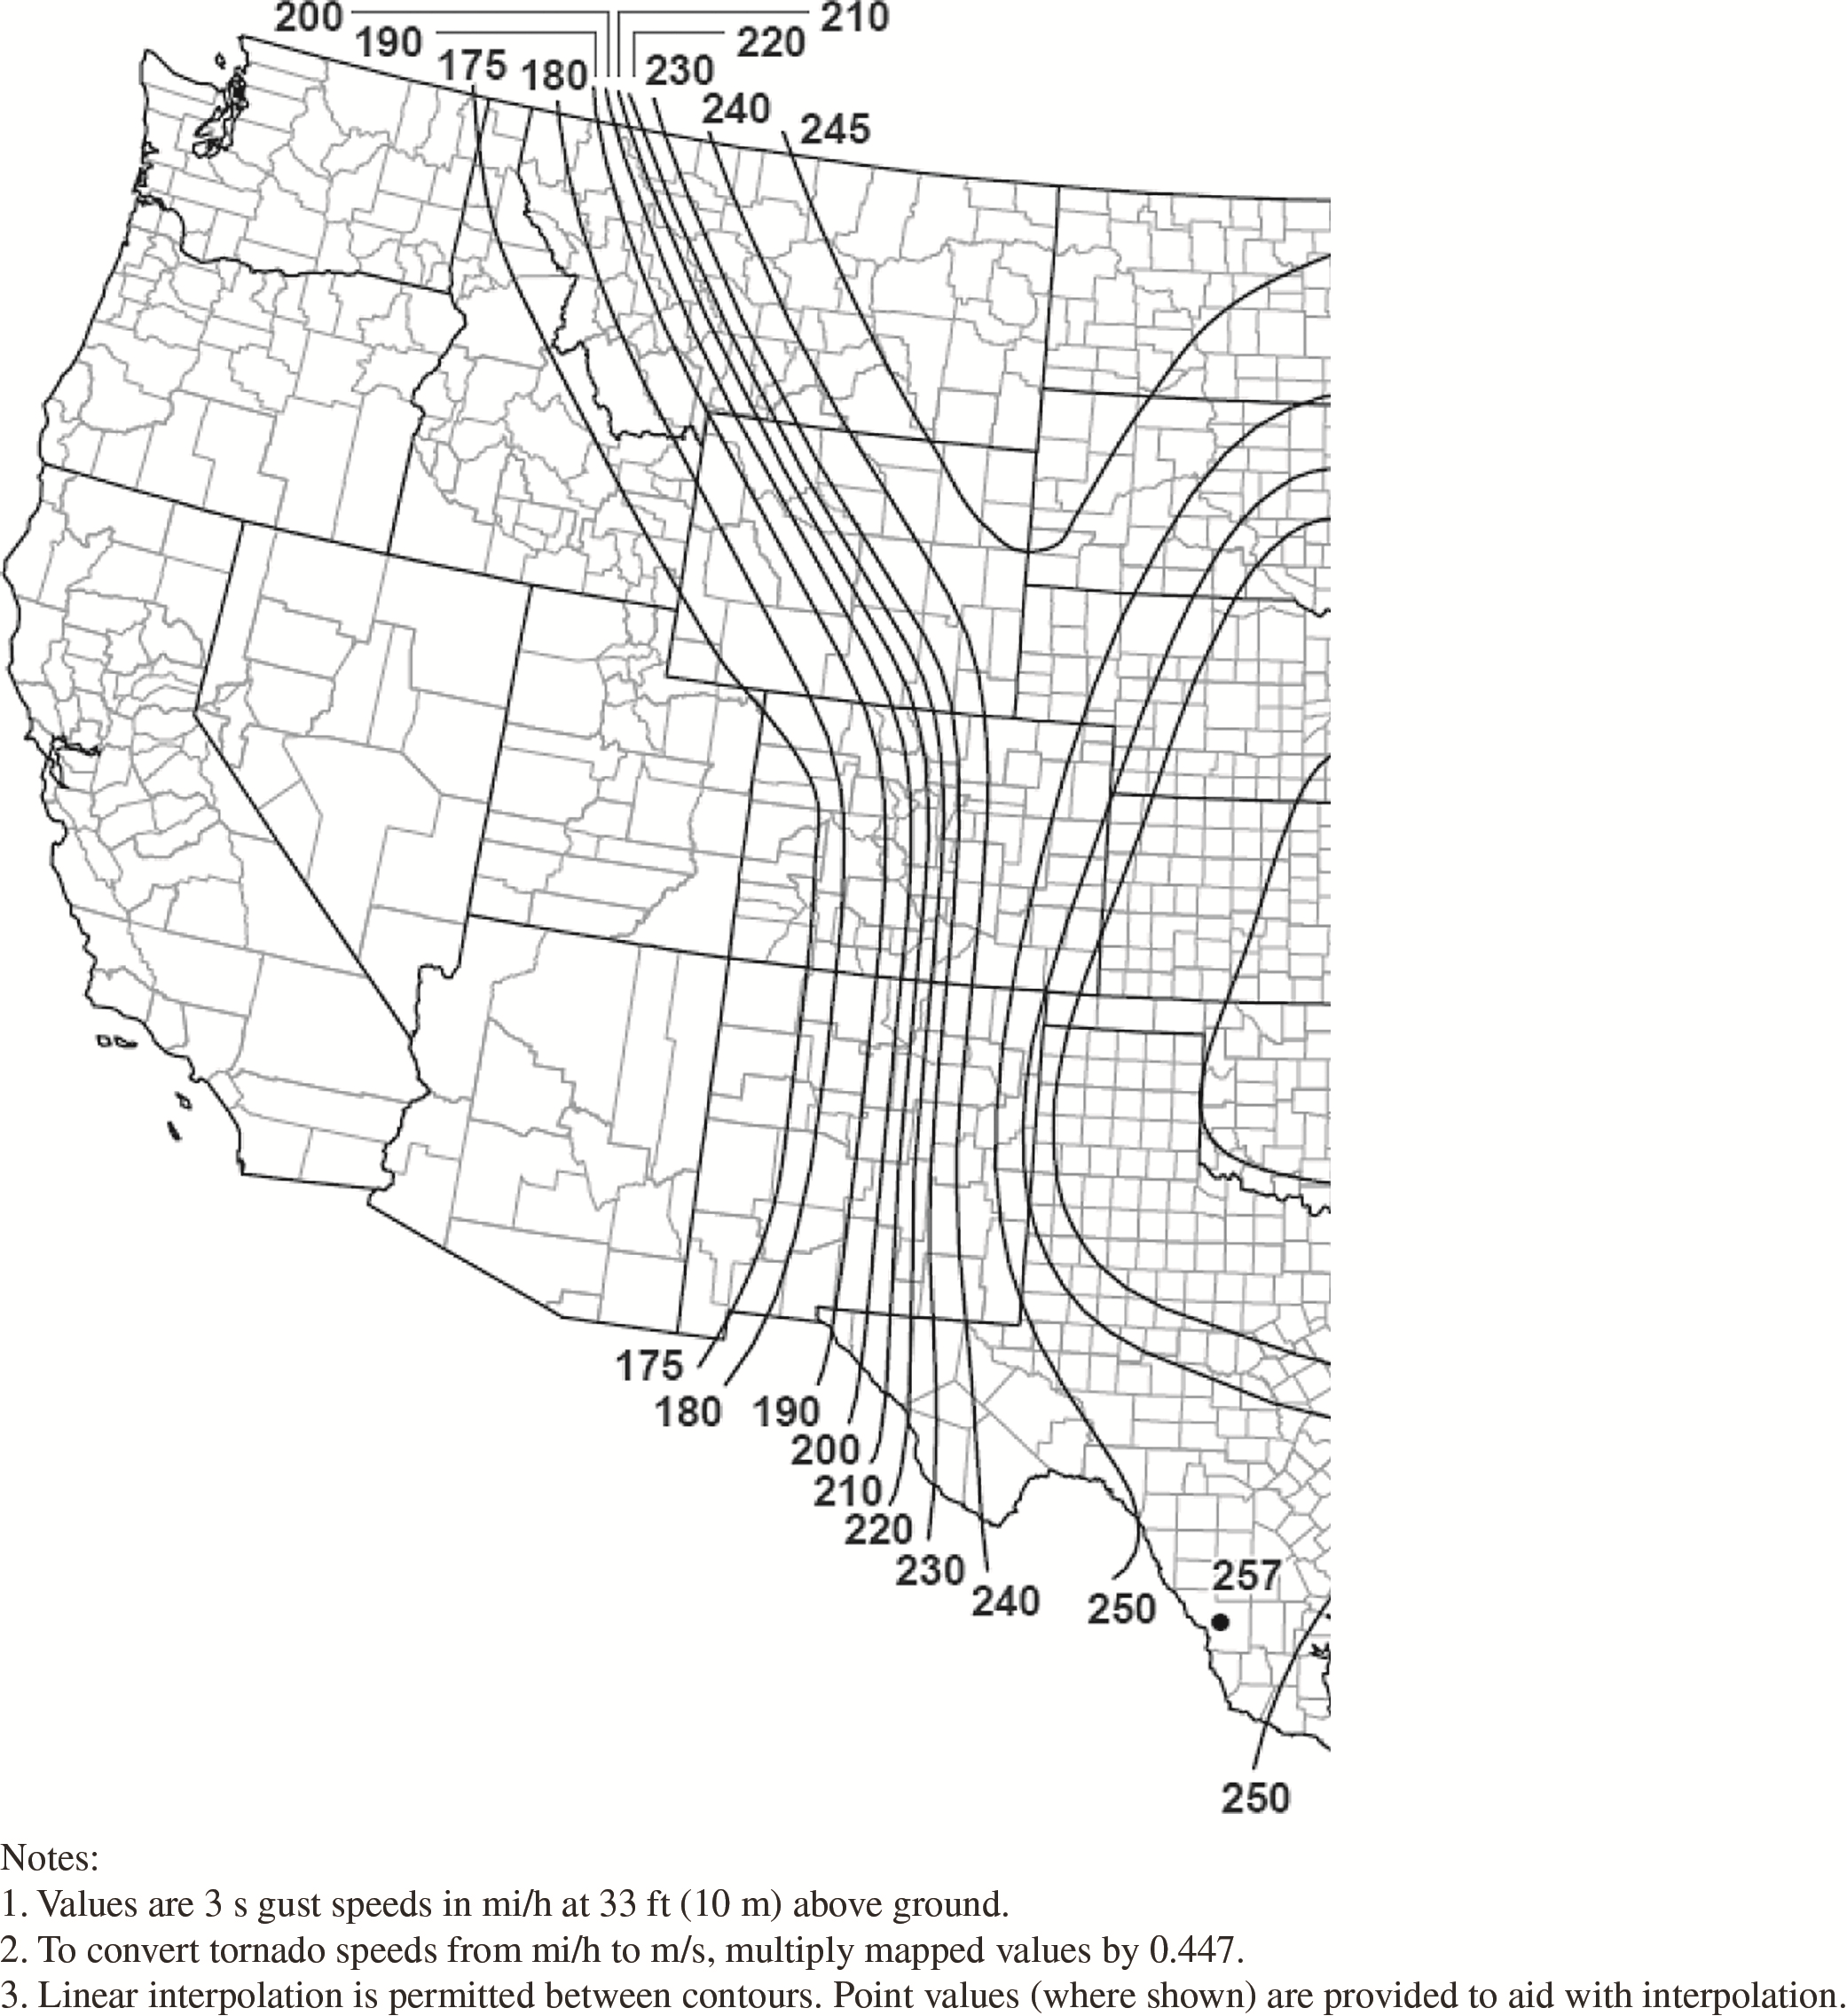
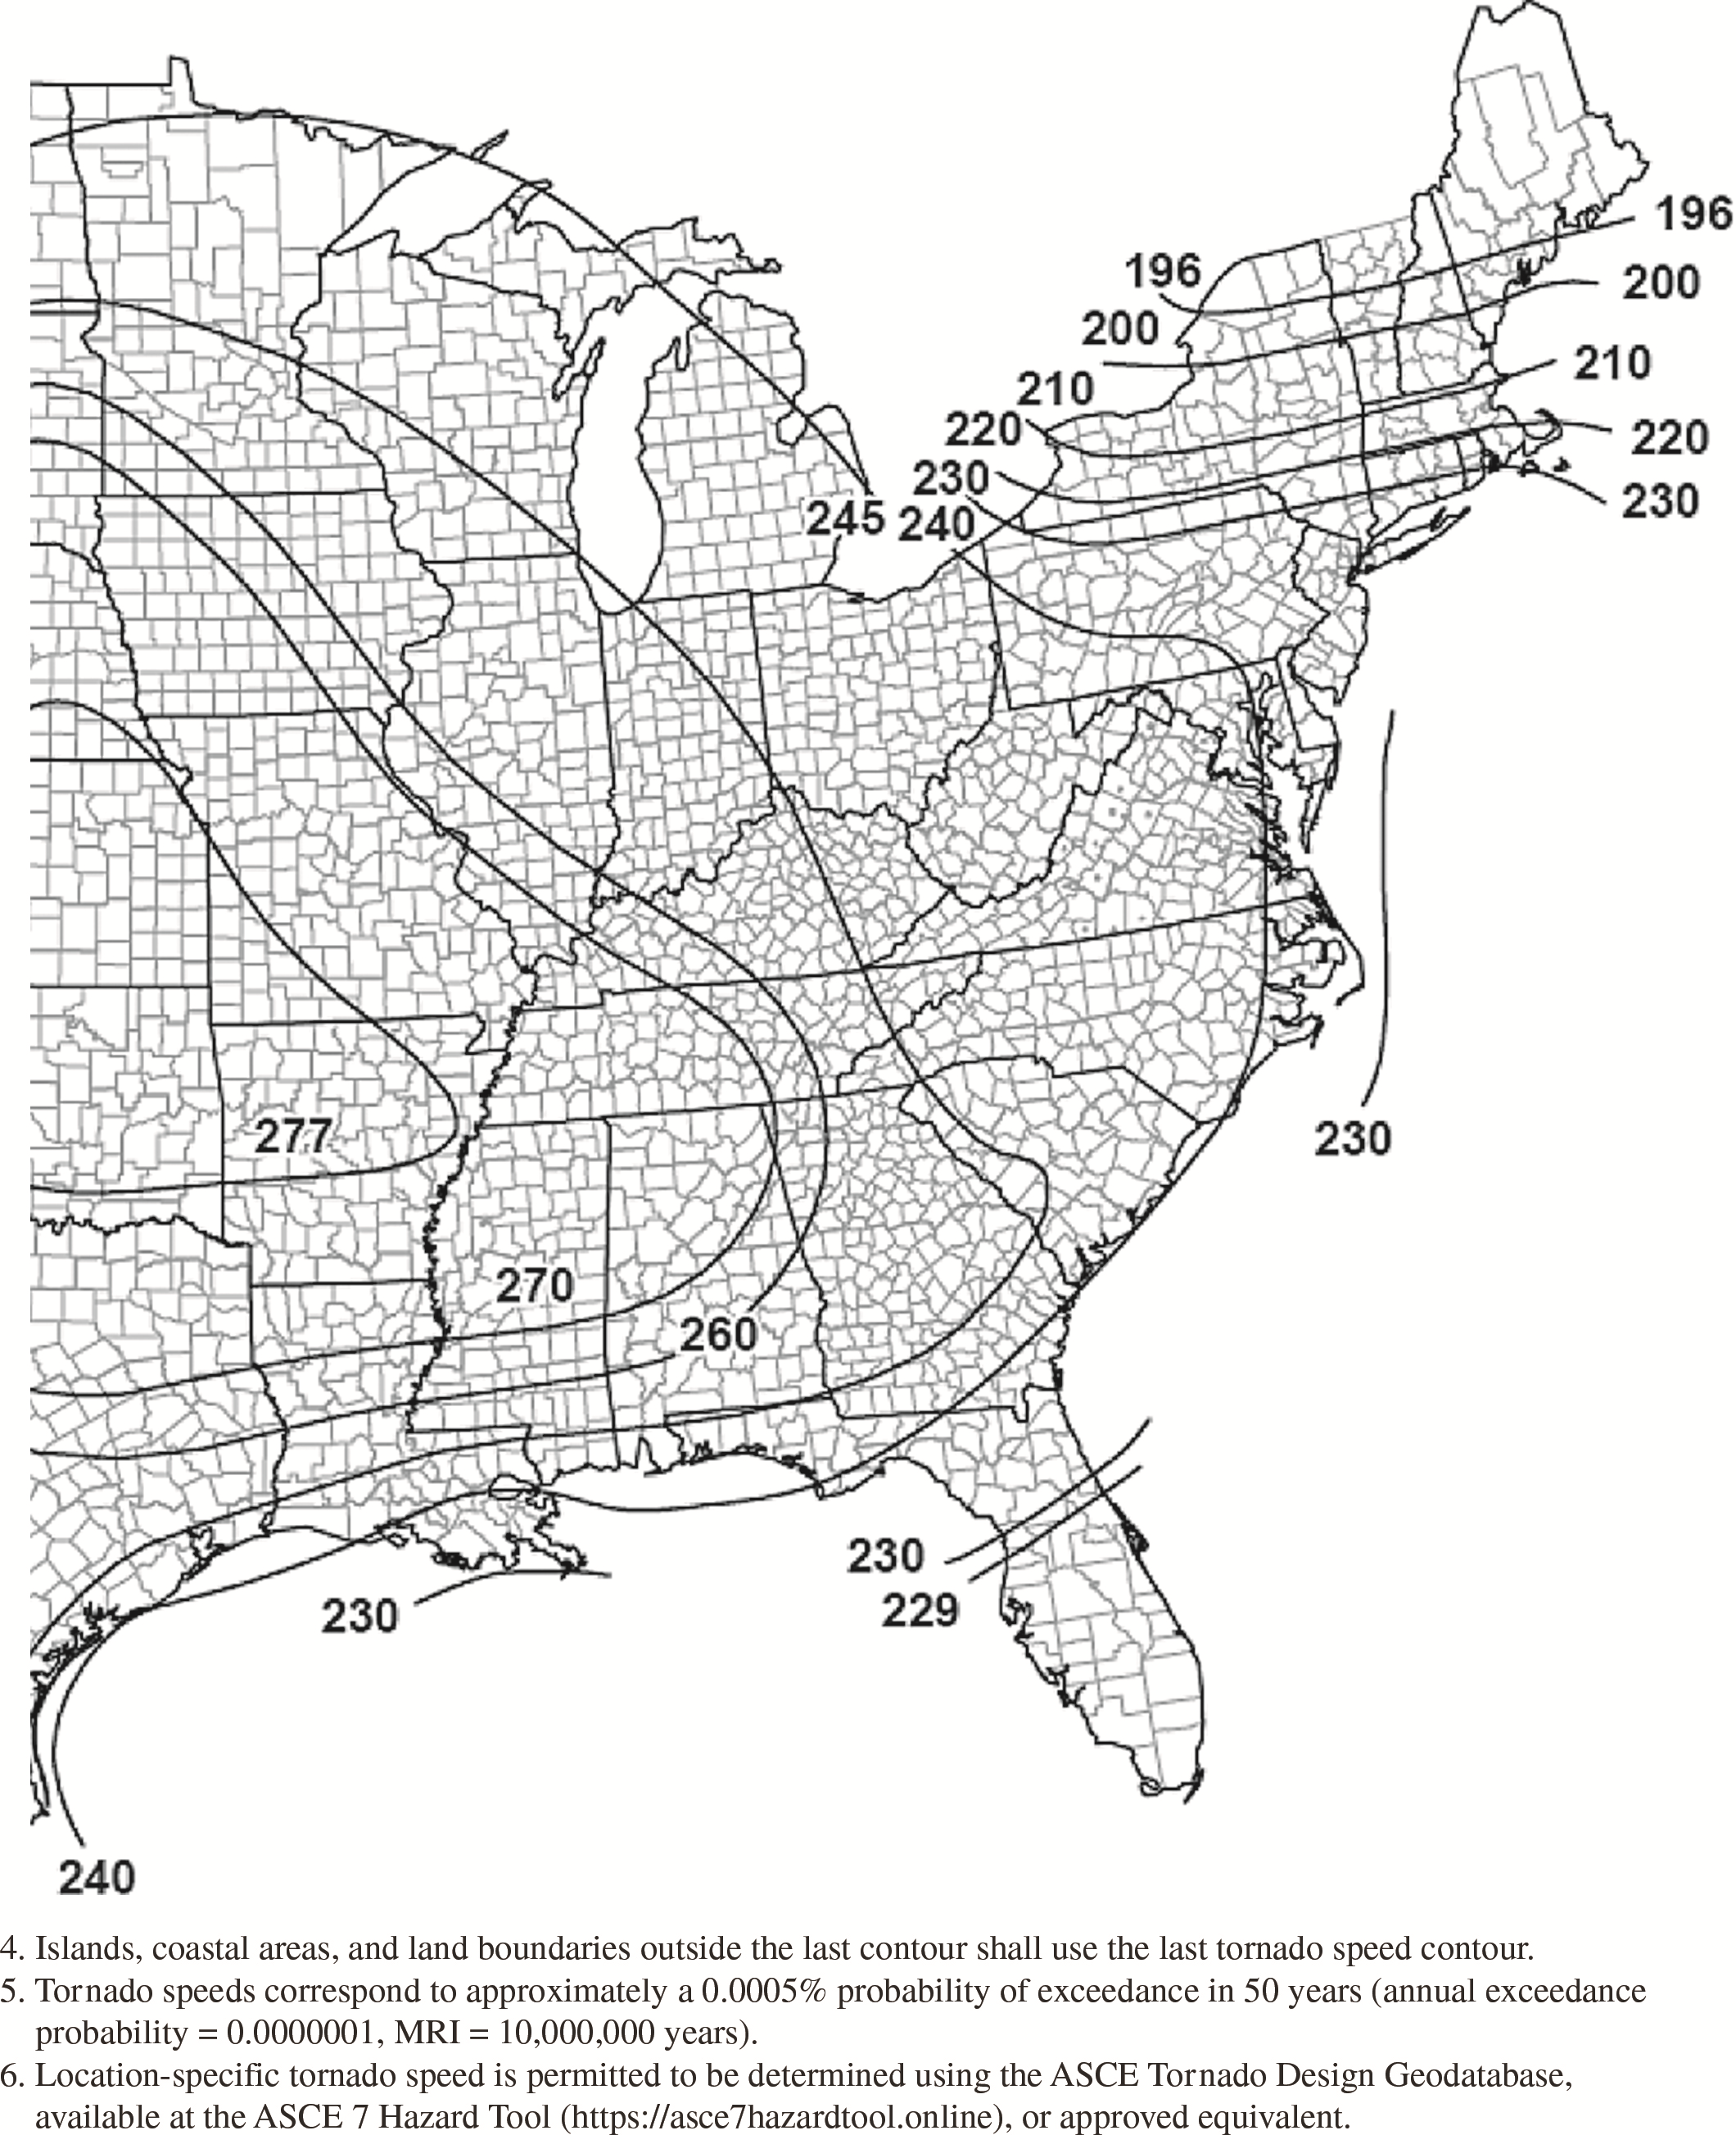
Figure G.2-4H. Tornado speeds for 10,000,000-year MRI for
effective plan area of 4,000,000
ft2
(371,612
m2).
Commentary
Tornado Hazard Maps for Long Return Periods
CG.1 Scope
This appendix provides tornado hazard maps for longer mean recurrence intervals (MRIs) than those included in Chapter 32, in support of performance-based wind design applications where use of hazard levels above the minimum specified in the standard may be appropriate. Design for longer MRIs may also be needed for tornado load designs required by other codes and standards. The maps presented in this appendix are not tied to a specific Risk Category like the maps in Figures 32.5-1 and 32.5-2, which represent preselected MRIs of 1,700 and 3,000 years for Risk Categories III and IV, respectively. For the longer MRI maps in this appendix, it is expected that the owner, perhaps in consultation with the designer, will select the appropriate map for their particular application. In some situations, the Authority Having Jurisdiction may require a longer MRI. For example, certain liquefied natural gas facilities require design for 10,000-year-MRI winds, “if adequate wind data are available and the probabilistic methodology is reliable” (PHMSA 2019). As another example, nuclear power plants and certain other energy facilities require design for tornadic wind speeds with MRI up to 10 million years (NRC 2007, DOE 2016, ANS 2016).
Where the longer-return-period tornado hazard maps of this appendix are being used, the designer should also refer to Appendix F to determine a basic wind speed at the same return period (where available) for use with the wind load provisions of Chapters 26 through 31.
CG.2 Tornado Speeds
The tornado maps in this appendix were produced using the same methodology as described in Section C32.5.1. As with nontornadic winds, the uncertainties in tornado speeds increase with increasing return periods. “The uncertainties are judged to be modest at the 3,000-year return period, say ± 10 mph, but are likely on the order of ± 30 mph for 10 million-year return periods” (Twisdale et al. 2021). Tornado speeds are contoured at 10 mi/h (4.5 m/s) intervals except for the innermost (greatest speed) and outermost (least speed) contours, which are shown to 1 mi/h (0.45 m/s) to aid with interpolation.
Appendix CG – References